Categories
Less Is More
Less is more for data visualization and storytelling.
This post is part of our Big Ideas series, a column highlighting the innovative thinking and thought leadership at IIeX events around the world. Tara Beard-Knowland will be speaking at IIeX Europe 2019 in Amsterdam. If you liked this article, you’ll LOVE IIeX Europe. Click here to learn more.
Eight or nine years ago, I attended my first external storytelling training for market researchers. There had been plenty of internal storytelling training up to that point, but this was my first experience of a professional storyteller bringing something to my world, the world of market research. This was part of a wider trend among market research agencies, and it is still popular today. Around this same time, there was also a surge in discussion about data visualisation, spurred on partly by David McCandless’s Information is Beautiful, first published in 2009. This made our data easier to understand.
All of this led to (largely) simpler, clearer reports and presentations across the industry, and there is continuing improvement over time. The core lesson I learned as part of this process was that it’s important to take time to simplify. The quote (variously attributed to Blaise Pascal, Mark Twain, John Locke, Henry David Thoreau and others) goes roughly: ‘I’m sorry this is so long; I didn’t have time to make it shorter.’ Shorter is, however, typically easier to understand and has greater impact. Less is, in fact, more.
Social intelligence (and using large-scale unstructured data more generally) have more to learn from the journey market research has been on.
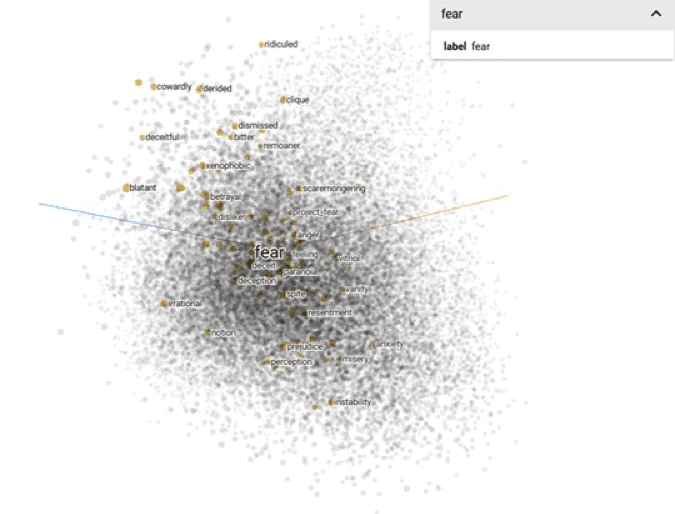
There is no shortage of beautiful dashboards, or even reports, coming from analytics and social intelligence companies and teams, especially visualisations that summarise data relationships. This industry has adopted many of the data visualisation tactics and learnings – but not always to good effect. I have seen – even presented myself – very complicated maps, networks and other data relationship graphics (including some whizzy 3D graphs). These are indeed visualisation of data, but they are not simple or easy to understand. Perhaps (although not always) useful for the analyst, but much less so for clients.
Storytelling with social intelligence data has its moments but tends, by and large, to be completely overwhelmed with data points. This is because there is Just. So. Much. Data. It is easy to get distracted by it, lost in it and even distressed by the fact that, AI or no AI, there is not time enough to look into everything. Many of the best and most compelling stories don’t tell you everything that is happening, they tell you what you need to know. If Agatha Christie had told her readers everything that happened, she would have had far fewer readers.
In fact, we need to be choosy about what we look at and even choosier about what we show. We need to find and then test hypotheses, looking for contradiction as much as confirmation. If we do not do this, we will never finish a single task, let alone a massive analysis. What’s more, we will have little long-term buy-in to use this data to make a real difference in businesses.
Expertise and grounding in market research and subject matter makes this both easier and more difficult. It is easier because we know what is surprising and what is already known. Leveraging this expertise, we can save time and thus money. But it is more difficult because it is easy to get caught up in all of the data too, because it is just so fascinating to have this new stream of information to enhance what we already know or to provide a different angle.
Ultimately though, time is a key component of the mix – it takes time to analyse the data well and then to tell valuable stories using the data. We can learn from the journey of market research. With large-scale unstructured data, we need to take the time not only to understand the data itself but also to simplify and story tell.
For 2019, the challenge I offer both to myself and to the industry I now work in is to take this advice to heart: less is more, even if it takes more time to get there.
Comments
Comments are moderated to ensure respect towards the author and to prevent spam or self-promotion. Your comment may be edited, rejected, or approved based on these criteria. By commenting, you accept these terms and take responsibility for your contributions.
Disclaimer
The views, opinions, data, and methodologies expressed above are those of the contributor(s) and do not necessarily reflect or represent the official policies, positions, or beliefs of Greenbook.
ARTICLES
Top in Brand Strategy
Trend Fatigue: Why Local Beauty Brands Need to Stop Chasing and Start Listening
Indonesia’s beauty market is booming. Local brands win by deeply understanding consumers—an edge multinationals can’t easily replicate.
Feby Ramadhani
Senior Product Researcher at ParagonCorp
Being Talked about Is Not Always Good for Brands
Being talked about isn’t always a win. Explore when talkability helps brands grow and how to plan campaigns that drive results.
Ramanathan Vythilingam
Associate Professor at Nanyang Business School
Karen Lynch
Chief Programming Officer at Greenbook
Why Brand Building Is the Top Priority for CMOs in 2026
CMOs are moving beyond ROI. With 62% tracking brand awareness, marketing is re-centering on brand as a critical growth driver.
Nicky Marks
CEO at Censuswide

Sign Up for
Updates
Get content that matters, written by top insights industry experts, delivered right to your inbox.