Categories
The Top 20 Emerging Methods In Market Research For 2015: A GRIT Sneak Peek
A sneak peak from the forthcoming GRIT Report at the adoption of emerging approaches in the industry.

Editor’s Note: The latest wave of the GRIT Report is in the hands of the designers now and will be published in just a few weeks! However, I’m a big fan of releasing sneak peeks of some of the findings, so today we’re giving you an advance view of one of our most popular question areas: the adoption of emerging approaches in the industry. Ray Poynter wrote the analysis for the report, and here is his take right from the rough draft. There are some important insights here, especially regarding the continued client-side adoption of some approaches that market research suppliers may be missing out on, so we hope you use this as a comparison point for your own offerings as we head into 2016.
When reviewing the market research approaches and techniques being used or considered we need to keep in mind that the GRIT sample tends to be drawn from people more interested in change and new approaches. This means the data should not be taken as being an audit of the whole research industry; rather the data are an indication of change and rate of change.
Four Categories of Adoption of New Techniques
As the chart below shows the GRIT participants usage of techniques produces four categories of adoption: Already Mainstream, Wide Level of Interest, Third Tier, and Niche.
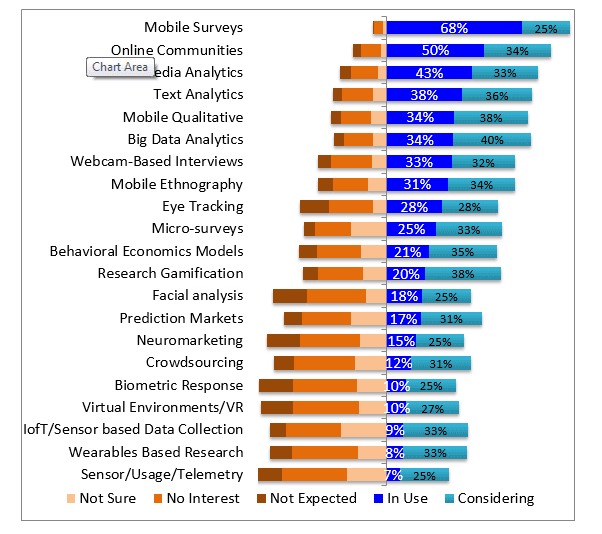
Already Mainstream
This group consists of Mobile Surveys and Online Communities, which as the trend data shows has been the picture for a couple of years.
Wide Level of Interest
This group has two elements, the first is the analytics/Big Data group and the second is the mobile enabled qual group. Both of these groups score well in terms of ‘In Use’ and in ‘Considering’.
Third Tier
This group show interesting levels of adoption and interest, but have not really broken through. This group comprises Eye Tracking, Micro-Surveys, Behavioral Economics, and Research Gamification.
Niche
The remaining items are all clearly niche at the moment. Only a few of the GRIT participants are using them and relatively few are considering them.
The Trends
The table below shows the key data since Q1 2013, i.e. over the last 2.5 years.
| % In Use | Q1-Q2 2013 | Q3-Q4 2013 | Q1-Q2 2014 | Q1-Q2 2015 | Q3-Q4 2015 |
| Mobile Surveys | 42% | 41% | 64% | 67% | 68% |
| Online Communities | 45% | 49% | 56% | 59% | 50% |
| Social Media Analytics | 36% | 36% | 46% | 45% | 43% |
| Text Analytics | 32% | 33% | 40% | 38% | 38% |
| Big Data Analytics | 31% | 32% | 31% | 34% | |
| Mobile Qualitative | 24% | 22% | 37% | 43% | 34% |
| Webcam-Based Interviews | 26% | 27% | 34% | 38% | 33% |
| Mobile Ethnography | 20% | 21% | 30% | 35% | 31% |
| Eye Tracking | 22% | 26% | 34% | 28% | 28% |
| Micro-surveys | 19% | 25% | 30% | 25% | |
| Behavioral Economics Models | 25% | 27% | 21% | ||
| Research Gamification | 15% | 16% | 23% | 21% | 20% |
| Facial analysis | 9% | 13% | 18% | 18% | 18% |
| Prediction Markets | 17% | 17% | 19% | 21% | 17% |
| Neuromarketing | 9% | 11% | 13% | 14% | 15% |
| Crowdsourcing | 13% | 14% | 17% | 19% | 12% |
| Virtual Environments/VR | 17% | 14% | 17% | 15% | 10% |
| Biometric Response | 7% | 8% | 13% | 10% | 10% |
| IoT/Sensor based Data Collection | 12% | 10% | 9% | ||
| Wearables Based Research | 7% | 7% | 8% | ||
| Sensor/Usage/Telemetry | 7% |
The key change over the last 2.5 years has been the arrival (in Q1 2014) of Mobile Surveys as the most widely adopted new technique.
The most recent data suggest that people are beginning to specialize, to pick those techniques which best suit them. For example, the average number of techniques mentioned as ‘In Use’ in Q1/2 of this year was 5.8, by Q3/4 this had fallen to 5.2.
The data do not show any sign that the newest or ‘hottest’ techniques, for example Wearables or Internet of Things are gaining widespread traction yet.
Users and Providers are Not the Same
When we look at buyers/users and seller/providers of research we see lot of similarity and some interesting differences.
| % In Use | Buyer/User | Provider | Gap |
| Mobile Surveys | 54 | 72 | -18 |
| Online Communities | 46 | 50 | -5 |
| Social Media Analytics | 53 | 41 | 12 |
| Text Analytics | 38 | 38 | 0 |
| Mobile Qualitative | 26 | 36 | -10 |
| Big Data Analytics | 40 | 32 | 8 |
| Webcam-based Interviews | 27 | 34 | -8 |
| Mobile Ethnography | 25 | 33 | -8 |
| Eye Tracking | 28 | 28 | 0 |
| Micro-surveys | 17 | 27 | -10 |
| Behavioral Economics Models | 17 | 23 | -6 |
| Research Gamification | 12 | 21 | -9 |
| Facial Analysis | 14 | 19 | -5 |
| Prediction Markets | 22 | 16 | 6 |
| Neuromarketing | 15 | 15 | 0 |
| Crowdsourcing | 16 | 11 | 5 |
| Virtual Environments/VR | 9 | 10 | -1 |
| Biometric Response | 11 | 10 | 1 |
| Internet Of Things Data | 10 | 8 | 2 |
| Wearables Based Research | 5 | 9 | -4 |
| Sensor/Usage/Telemetry Data | 6 | 7 | -1 |
Base: Buyer/User=212, Provider/Vendor=810
The cells where the differences are highlighted in blue show where the In Use figures are higher for the providers of research. These may reflect the greater awareness that providers have about the techniques that are being used, for example an awareness that mobile is being used or that research gamification has been employed to optimize the research design.
The cells highlighted in red are those where the users/buyers of research have higher numbers for In Use. These cases may reflect situations where clients are not buying their services from traditional market research sources, for example Social Media and Big Data Analytics, although interestingly Prediction Markets and Crowdsourcing, which have vibrant and growing suppliers outside of mainstream research, are also included.
The implication here may be that research suppliers are missing in out on both new revenue opportunities and serving a larger client base by not offering these capabilities credibly.
Comments
Comments are moderated to ensure respect towards the author and to prevent spam or self-promotion. Your comment may be edited, rejected, or approved based on these criteria. By commenting, you accept these terms and take responsibility for your contributions.
Disclaimer
The views, opinions, data, and methodologies expressed above are those of the contributor(s) and do not necessarily reflect or represent the official policies, positions, or beliefs of Greenbook.
More from Ray Poynter

Word Cloud Plus Extracts Hot Buzz Topics
The GRIT data collected toward the end of 2022 included 918 open-ended replies to the question “Related to insights, research, or analytics, which top...
Observational Data Has Problems. Are Researchers Aware of Them?
Observational data is a tempting shortcut for insights but researchers must consider its potential shortfalls
Want it Faster, Cheaper, Better? Then You’d Better Sign Up to Prescriptive Analytics
Using Prescriptive Analytics to navigate the data-filled world.
Company Size Matters: The Differential Impact of COVID-19
A deep dive into the very different experiences of the MRX community during COVID-19.

Sign Up for
Updates
Get content that matters, written by top insights industry experts, delivered right to your inbox.