Categories
Why Do Google Apps Want My Sensitive Data?
Gmail case study on data privacy and app permissions
Data privacy has been at the forefront of the legislative battle waged by Marketing Research organizations like the Marketing Research International Institute, the Marketing Research Association, and ESOMAR. In fact, this issue looms large in the media as well. Advances in technology only make the matter more urgent.
Privacy is linked to the exploding number of Android and Apple apps on ubiquitous smart phones and iPads. When one downloads an app, a game, a newspaper or Skype, that application requests permissions by default. Most of us barely glance at what we agree to.
Are these permissions necessary for the application to run? More important, are they an invasion of privacy?
There is a hidden tax in our “free” mobile apps: the debt is paid is in the coin of privacy. “Least privilege” or “need to know” are irrelevant and even strange notions to some application developers. And it is hard to differentiate among the legitimate, superfluous or even malicious permissions.
Each and every time you install an application, it is likely that you will be asked for a large number of permissions. “Can I access your entire life (…just in case?)”.
Google requests permission for more than 200,000 apps. In this paper we examine one of the most well-known of these, Gmail. We will present results of the Gmail segment and suggest a model for identifying anomalies in permission-requests made by our downloaded apps.
GMAIL
When one downloads an application, Android usually suggests a similar app, much like Amazon might suggest a similar book or Nordstrom’s a similar purchase item. The ‘suggestions’ are derived by formula. This is no different, in marketing research parlance, from a priori segmentation. In other words, certain apps go with other apps. Google makes their categories public and the data available.
In our database, we have downloaded close to 189,000 data points (each an app). These are provided in comma-separated value format, which is easily read into Excel.
With each application, Google makes available whether that app requests up to 189 permissions. Most of them are quite common. Some are not.
Hypothesis
It is reasonable to assume that Google segments apps for a reason. After all, suggested apps—be it a calorie counter, a simulator war game, or a memory exerciser—are designed to carry out certain functions.
Thus, one would expect that the permissions granted to similar apps would be similar. It is against this hypothesis that we can search for unusual, or suspicious, permissions. Hypotheses are not always straightforward, but they are necessary for our inquiry.
Computer programmers have approached me to find a one-size-fits all algorithm to ‘weed out’ bad permissions. In my view, this is not possible, because ‘bad’ is a relative term. For example, it would be ‘bad’ if I managed to the codes to the US nuclear arsenal (and worse for my enemies), but not ‘bad’ if the President of the United States had access to those same codes. It is “good” if I know the password for my bank account, “bad” if someone else does.
Our hypothesis, then, is that the apps contained in the Gmail cluster should have similar permissions. We will be looking for exceptions to that rule and then deciding if they are ‘bad’.
Gmail Similar Apps
Table 1 lists the Aggregated Permissions that are Requested within the Gmail cluster. The most frequent permissions are shown in descending order by percentage of requests within the similar this apps group.
Table 1
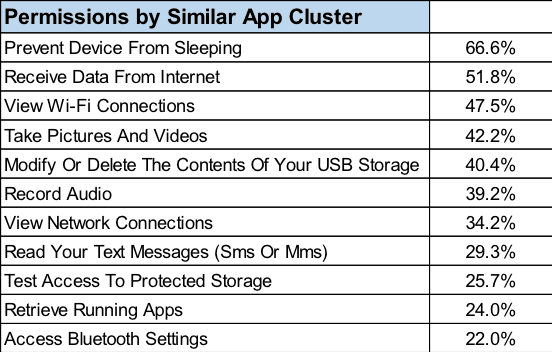
Naturally, some permissions float to the top. We are seeking the uncommon ones. Glancing at a simple output does not get us far enough. Further analysis is needed.
Network Analysis
Network Analysis is the practical use of Graph Theory. Graphs can be used to model many types of relations and processes in physical, biological, social and information systems. Many practical problems can be represented by graphs.
In computer science, graphs are used to represent networks of communication, data organization, computational devices, flow of computation, and so on. For instance, the link structure of a website can be represented by a directed graph, in which the vertices represent web pages and directed edges represent links from one page to another. A similar approach can be taken to problems in travel, biology, computer chip design, and many other fields.
There are many statistical measures calculated in Network Analysis. For our practical purposes, only two measures need to be subjected to our analysis. These are “degree”, that is, how popular a given node is, and eigenvector—how well connected a node is to other clusters. We call this a ‘bridge’.
The first step is to structure the data on which apps are connected to which permissions. The program I use, NodeXL, is an open-source Excel back-end program. Together with SPSS, the data is shaped, placed into Excel, and run with the analysis. The procedure produces the following graph (Figure 1).
Figure 1 – Network Analysis of Gmail Similar Apps Cluster and Permissions Requested
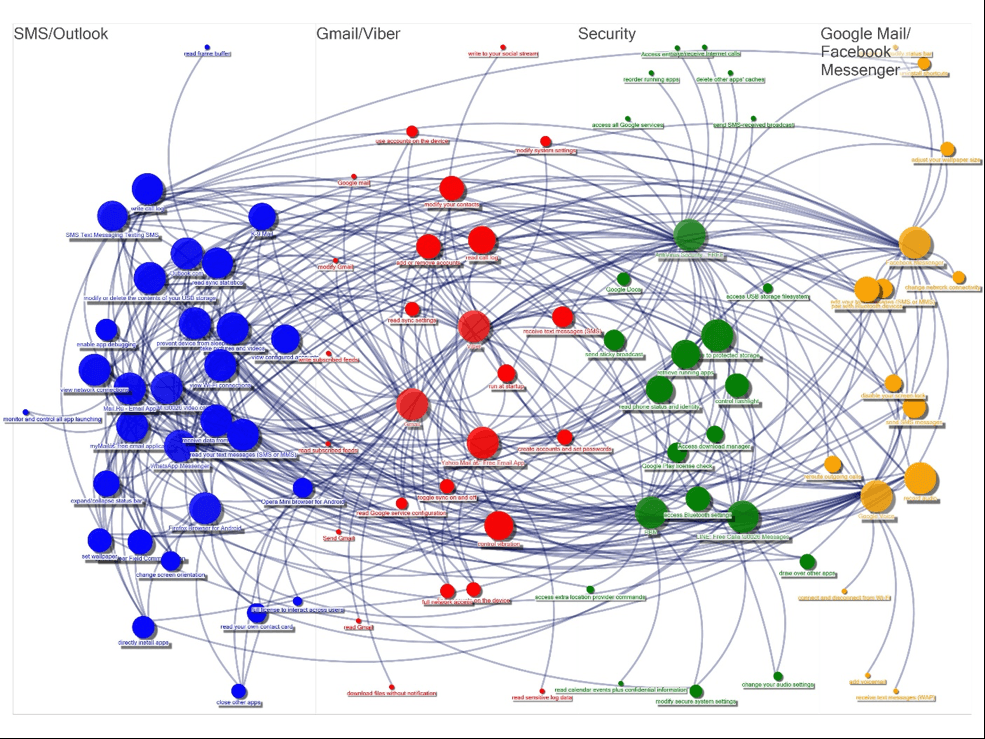
The size of each app and permission is the eigenvector centrality—its bridge factor. Despite being classified by Android as similar apps, our analysis has isolated four distinct clusters within the Gmail group. These clusters are not segmented by Google, but rather by which permissions they share. Not unexpectedly, the clusters divide into sub-segments of Gmail/Gmail-like apps.
The Analysis—Backward Assumptions Reveal Exceptions
Network Analysis is useful when examining all kinds of data, such as Twitter and website links, restaurant data and media research. We can fit Walmart sales data, throw the data into the analysis, and then advise the client as to which items we suggest he put on sale.
The general approach is to examine the top Degree (popularity) and eigenvector centrality (bridge). These key measures suggest a sales strategy.
Here, though, we are looking for exceptions, the opposite of what ‘should be’. To do so, we reverse the Degree and Eigenvector Centrality, searching for the smallest values with the Gmail Google group.
When we reverse the network analysis statistics, we see that some permissions have low degree and eigenvector centrality, which means they are uncommon.
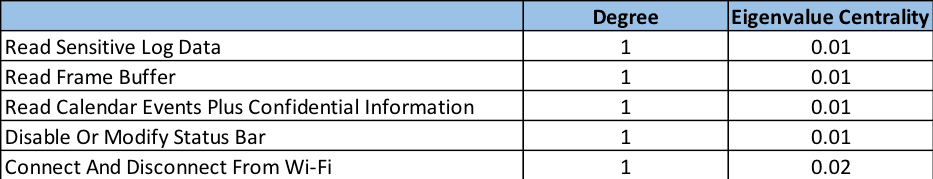
The table below shows a smattering of information about the isolated permissions coming from the network analysis. Let’s see what we have.
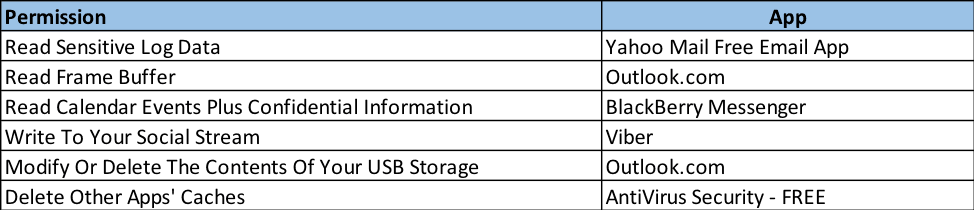
Glancing at this chart, one might ask the following questions.
- Many of us use Yahoo Mail, but do we want it to read our sensitive log data?
- Are we comfortable with Outlook taking a screenshot of other apps programmatically, without root permission (frame buffer)?
- BlackBerry might be on its way out, but while you were on your cell phone it was reading not only the calendar but confidential information. What was it doing with the data?
- Do we want Outlook to automatically delete contents of our USB storage?
- AntiVirus Security might be a little too secure. We give it permission to automatically delete other apps caches. Which apps? What caches?
Generally speaking, I wrap up my articles with useful tips. Today stands as an exception: I leave my readers with more questions than answers. This fittingly reflects the reality of our information age.
Comments
Comments are moderated to ensure respect towards the author and to prevent spam or self-promotion. Your comment may be edited, rejected, or approved based on these criteria. By commenting, you accept these terms and take responsibility for your contributions.
Disclaimer
The views, opinions, data, and methodologies expressed above are those of the contributor(s) and do not necessarily reflect or represent the official policies, positions, or beliefs of Greenbook.
More from Michael Lieberman
Deductive Reasoning and Effective Marketing Research
Learn about deductive reasoning, a logical process of drawing conclusions from premises. Statistics can support this process when data analysis and ev...
The Misrepresentation of Statistical Accuracy – Unethical, but Fraud?
When does misrepresentation of statistical outcomes turn into fraud?
Making the Journey – From Marketing Based Analytics to HR
Why HR and analytics are the perfect pair.
ARTICLES
Navigating the ‘Build vs Buy’ Decision in ResTech
As AI simplifies product-building, MR teams must weigh build vs. buy carefully, balancing governance, reliability, and research expertise.
Jiten Madia
Founder & CEO at flowres.io
Right-Size Your Restech
Restech can save time and money, but underuse leads to wasted value. Learn simple steps to maximize your tech investment and boost renewal success.
Z Johnson
Consultant at MRXplorer
Capitalize on Market Research's Tech-Forward Future
Discover the latest innovations and technologies in the restech space amidst industry-wide slowdowns with our market research website.
John Bird
Executive Vice President at Infotools
The Evolution of B2C Consumer Segmentation in the Digital Age
Consumer segmentation has evolved from traditional demographic methods to more advanced techniques in the digital age, driven by vast data availabilit...

Sign Up for
Updates
Get content that matters, written by top insights industry experts, delivered right to your inbox.