Categories
How Happiness Impacts Satisfaction and Recommendation Measures
People’s self-assessed happiness influences their survey responses.
Companies regularly measure customers’ satisfaction with products or services, particularly with the staff who serve the customers. Companies also regularly ask customers about their intentions to recommend the business to others (often using the Net Promoter Score). Both the satisfaction and recommendation measures are used to strengthen the business and often to reward the staff who have performed well.
The underlying and unstated assumption with both measures is that customers make their judgments based on their actual experiences, and so the results are comparable over time. This assumption can lead to teeth-gnashing and berating of staff if the satisfaction or the NPS scores decline. But whether the mindsets of customers are all the same from measure to measure is not tested. Yet it should be, we strongly suggest.
Why should we test if customer mindsets differ?
Research shows that in general happiness flows in a U curve, with the young and the older being happy and the middle-aged markedly less happy.[1]
This finding had us wondering whether all customers respond to satisfaction and recommendation queries in the same way, and whether one’s happiness mindset affects your answers to these measures.
Does one’s happiness influence satisfaction and recommendation answers?
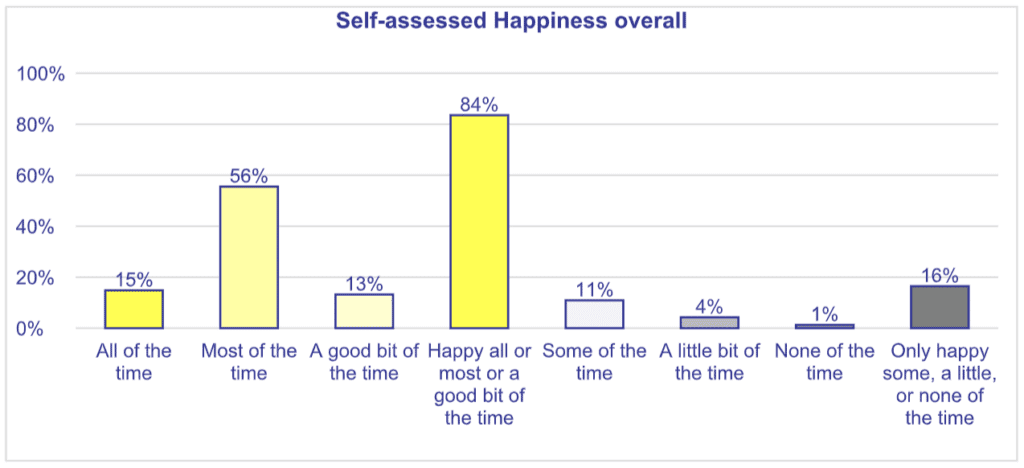
We tested this hypothesis by adding the happiness question to a satisfaction and recommendation measure undertaken for an Australian bank, before analysing the 3,570 completed responses by satisfaction and recommendation by age groups. To retain comparability with previous surveys, the happiness question was asked at the end of the survey. The “not happy” participants group was defined as those who were happy only some of the time, a little of the time, or none of the time. The “happy” group was defined as those who were happy all, most, or a good bit of the time. Participants self-assessed their happiness, as they did with their satisfaction and their recommendation intention.
Age does not impact satisfaction or recommendation
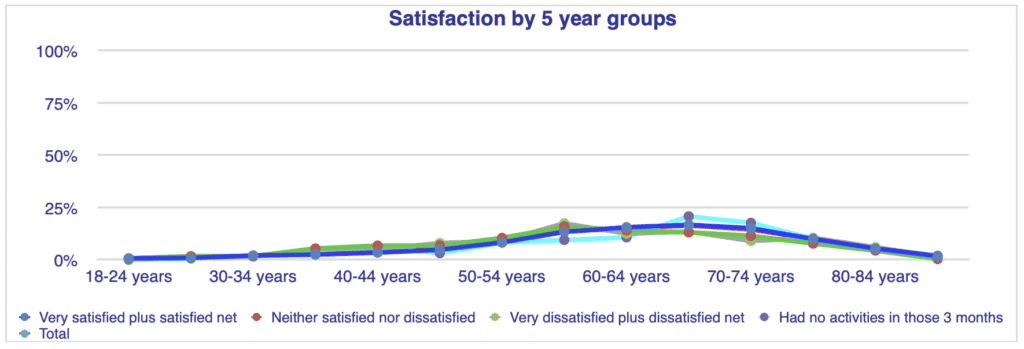
Satisfaction with the bank was analysed by five-year age groups, and in this study, the satisfaction measures were consistent with each age group in proportion to the age group’s proportion of the total. This finding indicates that the happiness by age group U curve does not apply to these satisfaction measures.
DERHAM INSIGHTS RESEARCH
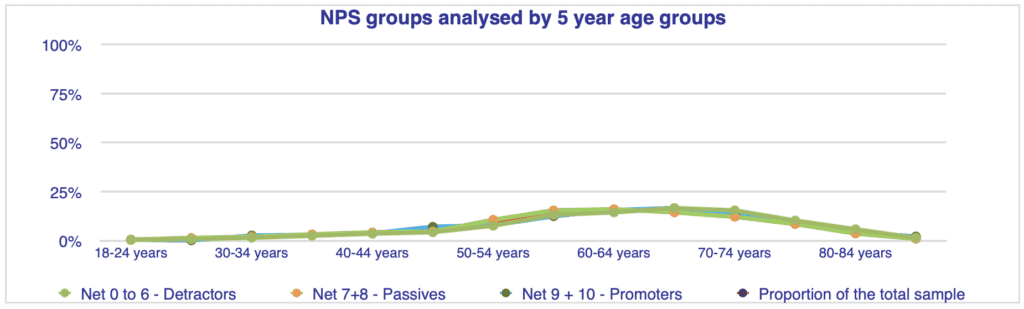
The NPS categories (Promoter, Passive, Detractor) were then cross-analysed by five-year age groups. In this study, the intentions to recommend were consistent across each age group with its proportion in the overall sample.
This finding indicates that the happiness by age group U curve did not apply to recommendation intention.
DERHAM INSIGHTS RESEARCH
The age-related U curve of happiness appears not to apply to measures of satisfaction or of recommendation.
For most, life is rosy!
We then looked at participants’ self-reported happiness and saw that, for most, life was rosy.
DERHAM INSIGHTS RESEARCH
Happiness mind-states do affect satisfaction and recommendation
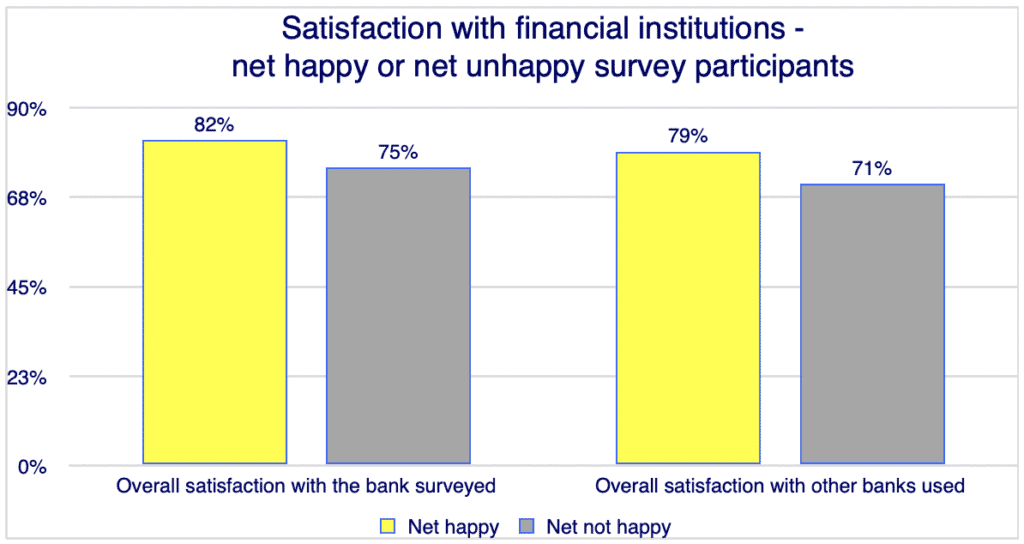
But when we reviewed satisfaction and recommendation by the participants’ self-assessed happiness measures, a different story emerged.
We found that those who were not happy consistently rated this bank and other banks they used at lower levels than those who were happy.
DERHAM INSIGHTS RESEARCH
In NPS terms, the survey participants who were happy were more likely to be Promoters of the bank than were those who were unhappy. Those who were unhappy were more likely to be Detractors than happy people. Only among the Passives group were those who were happy and those who were unhappy customers almost in alignment.
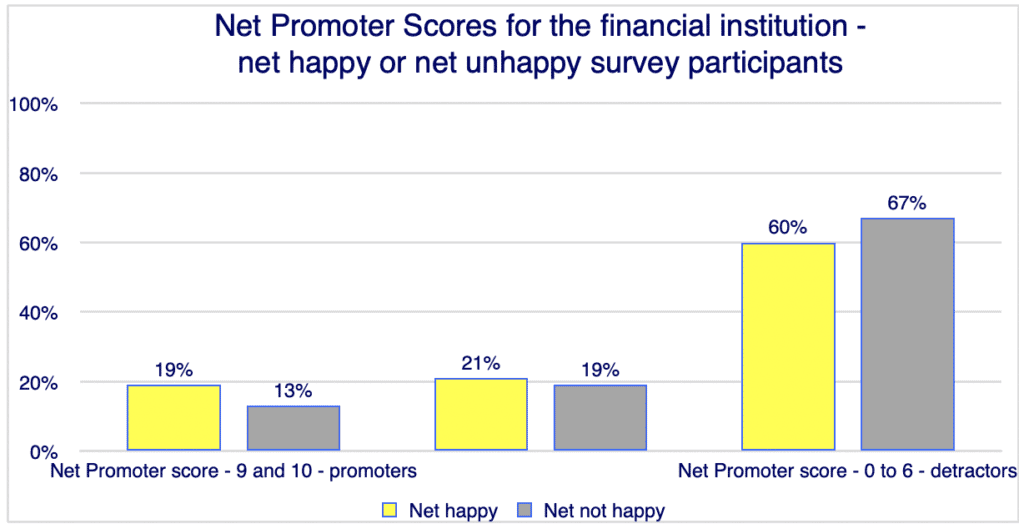
DERHAM INSIGHTS RESEARCH
Did contact with the bank change satisfaction?
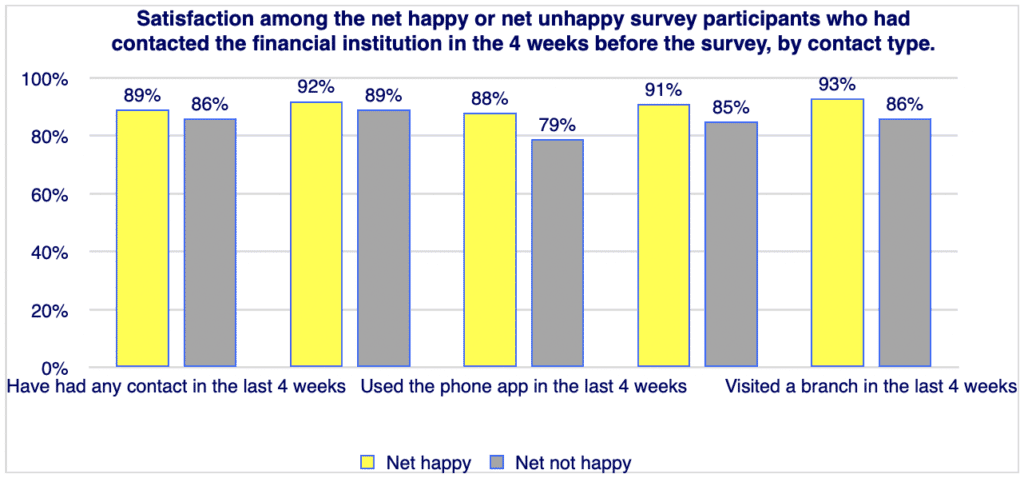
We then looked to see if contact with the bank made any difference to participants’ satisfaction with it, according to their contact type. As the graph shows, those who contacted the bank in the last four weeks and were also self-assessed as happy were more satisfied with the bank than those who were unhappy.
Those who were unhappy were particularly less likely to be satisfied with the electronic forms of access but were also less satisfied with the branch staff and the service they received in the branches. So, the problems affecting the unhappy people’s assessments of bank services were not (just) caused by any possible personal problems using its technology.
DERHAM INSIGHTS RESEARCH
Conclusions
These results are striking and clearly suggest that customers’ satisfaction and intentions to recommend are influenced by their states of mind, in happiness terms.
Whether unhappy people interact with the bank and its apps and people and services in a disgruntled way that generates a negative response and so lowers the unhappy person’s assessment, or whether their state of mind merely ensures that everything they touch, is marked down in some grey way that reflects their mindset, was not explored in this survey.
Accordingly, these results are indicative and show a need to further explore how unhappy people make their assessments of satisfaction and intentions to recommend, and whether their approaches are consistent with or differ from those of happy people.
In advance of such studies, companies should add the happiness question to all satisfaction and recommendation measures in future, as changes in those measures could be influenced by changes in customers’ happiness, as well as changes in company performance.
By measuring all three elements, companies can better assess whether changes in their satisfaction or recommendation intentions are because of changes in their own performance or are influenced by an increase or a decrease in customers who are happy or unhappy.
References
[1] Multidimensionality of Longitudinal Data: Unlocking the Age-Happiness Puzzle* Ning Li, Melbourne Institute of Applied Economic and Social Research, The University of Melbourne, Melbourne Institute Working Paper No. 4/14
Comments
Comments are moderated to ensure respect towards the author and to prevent spam or self-promotion. Your comment may be edited, rejected, or approved based on these criteria. By commenting, you accept these terms and take responsibility for your contributions.
Disclaimer
The views, opinions, data, and methodologies expressed above are those of the contributor(s) and do not necessarily reflect or represent the official policies, positions, or beliefs of Greenbook.
More from Philip Derham
Satisfaction and Recommendation: Should 2 KPIs Be Merged Into 1?
Satisfaction and recommendation – should 2 KPIs be merged into 1?

Sign Up for
Updates
Get content that matters, written by top insights industry experts, delivered right to your inbox.