Categories
Automatically Write and Email Reports with R, SendGrid, & Displayr
Tim Bock shares step-by-step instructions on how to use R to automatically write and send emails based on automatically computed analyses.
This post explains how to use R to automatically write and send emails based on automatically computed analyses (yep, everything automated). This means that when analysis changes or is updated, the email body text changes as well. The email can then be automatically sent to clients based on a trigger event (e.g., only when results are interesting) or periodically. All of this is can be done by using R code in Displayr, as illustrated in this post.
The tools: R, Displayr, and SendGrid
To automatically write and send email reports we need to have three tools:
- A programming language. If the analysis is non-trivial, R is usually the best way forward.
- An app that can automatically run the analyses at specified times. I’ve used Displayr. Of course, if you have the time you can avoid this commercial product and set up your own servers. (Disclaimer, I work for Displayr.) You can read this post to see how to get your data into Displayr and sign up to Displayr here if you do not already have an account.
- An app to actually send the emails. I’ve chosen an email delivery application called SendGrid because R can work with its API.
Step 1: Set up the analysis to automatically update
The first step is to perform the analysis. Presumably, you want to set this up so that you have a live feed of data with the analysis updating automatically. See Automatically Updating Data and Dashboards in Displayr for more about this.
Step 2: Create a SendGrid account so you can send emails
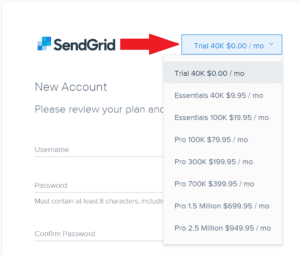
Go to the Sendgrid account signup page to create your account. Enter a username, password and email address and select the 30-day free trial option which allows you to send up to 40,000 emails. Click the Create Account button and then complete the additional fields on the next page (your role, company size, etc.) to complete the account setup process.
Step 3: Create a SendGrid API key
Once your SendGrid account has been set up, you can now create a SendGrid API key. The API key is a code that will enable your own R code to ask SendGrid to send emails. From your SendGrid account dashboard:
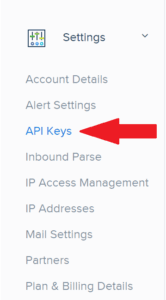
- Select Settings > API Keys
- Click the blue Create API Key button in the top right corner of your screen.
- On the Create API Key screen, enter an API Key Name (for example, Displayr_APIKey).
- Select the Full Access option.
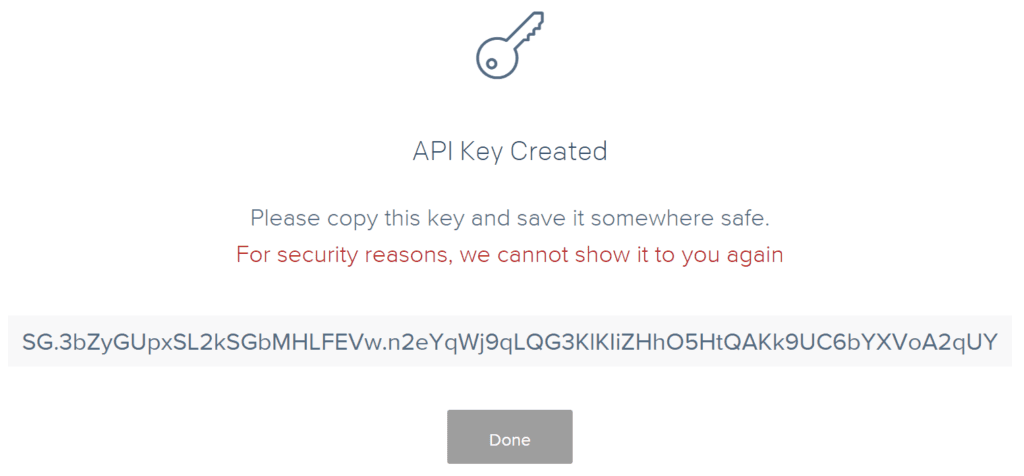
- Click the Create & View button to generate and display the API Key.
- Click on the displayed API key to copy it.
- Paste the key into a text editor, and save it to a text file on your hard-drive for safe-keeping. Note that for security reasons, SendGrid will not display the API key again.
Step 4: Write the email body
The next step to automatically write and email reports is to write the email body. The message text for the email needs a string, stored in Displayr in an R Output. To create an R output, open Displayr and select Insert > Analysis > R Output. You then type in completely standard R code, referring to the data in your Displayr document.
In the rest of this post, I assume that the R Output that contains the email content is called body.
For example, a simple document may contain a set of NPS scores for different brands, like those shown in the table below.
Using R, I can pull out the highest and lowest results from the table (which in this case are for Google and IBM), and I can construct the following rather messy-looking piece of text:
If you sign in to Displayr you can look at the example code that I used to build this message from the table above.
It may look messy now, but when the email is created, the \n tags will be converted into line breaks, and it will produce an email that looks like this:
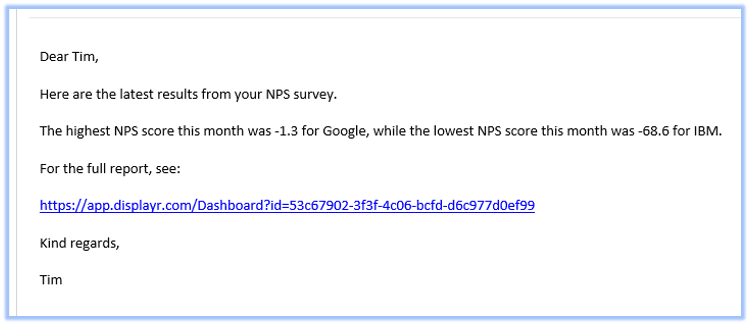
Additionally, you can include the URL of your published Displayr document in the message. To obtain the URL, first, export your document using Export > Web Page, and then copy and paste the URL of the resulting page.
Step 5: Generate the automated email by creating an R output in Displayr
Next, to generate the automated email, you will need to create an R Output in Displayr.
Add the following to the R CODE box which loads the R libraries needed to create and send the email.
|
1
2
3
|
require(httr)require(jsonlite)require(flipTime) |
The next line will determine how frequently to run the code and therefore send the email. This line ensures that the code is re-run every 24 hours and that the dashboard is automatically updated to show the latest results.
|
1
|
UpdateEvery(24, "hours", options = "snapshot") |
Add the next line with your SendGrid the API Key entered in the quotes.
|
1
|
key1 = "your_api_key" #enter your API Key here |
Specify the email parameters and construct the automated message
Next, the email parameters are specified and the email message is constructed. To do this, enter the recipient’s email address in the first line (to.email). It is a good idea to first enter your own email address here so you can test if the script is working as expected. The sender’s email address is entered in the second line and can be any email address you choose (from.email). You can also specify the email subject and message body here. In the previous step, I described how to automatically write the content of the body. Alternatively, you could replace body with a static message in the fourth line of code below (e.g., message.body= “Hello here.”).
|
1
2
3
4
5
6
7
8
9
10
11
|
to.email = "[email protected]"from.email = "[email protected]"subject = "Testing Sendgrid on Displayr"message.body = bodymsg = sprintf('{\"personalizations\": [{\"to\": [{\"email\": \"%s\"}]}], \"from\": {\"email\": \"%s\"}, \"subject\": \"%s", \"content\": [{\"type\": \"text/plain\", \"value\": \"%s\"}]}', to.email, from.email, subject, message.body) |
The final bit of code is the actual SendGrid API call which sends the email.
Note, if you want to limit emails sends only to a specific trigger event, it is as simple as adding a plain-old if statement before this code.
|
1
2
3
4
5
|
body = msg, config = add_headers("Authorization" = sprintf("Bearer %s", key1), "Content-Type" = "application/json"), verbose()) |
Check the Automatic check box next to the Calculate button to run the code. You should receive an email at the recipient email address you specified in the code.
Step 6: Customize formatting using HTML (Optional)
You may want to apply some custom formatting to your emails rather than just sending them as plain text. To do this, you only need to change the content parameter line in the R code above from “text/plain” to “text/html”.
|
1
|
\"content\": [{\"type\": \"text/html\", |
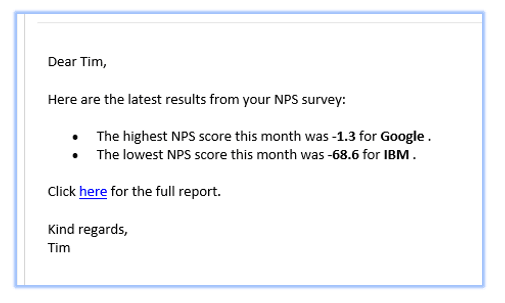
You can now use standard HTML formatting tags in your message body text. For example, you can replace the body variable above with the following to generate an HTML-styled email.
body = paste(“<p>Dear Tim,</p>”,
“<p>Here are the latest results from your NPS survey:</p>”,
“<ul><li>The highest NPS score this month was <strong>”, max.value, “</strong> for <strong>”, max.label, “</strong>.</li>”,
“<li>The lowest NPS score this month was <strong>”, min.value, “</strong> for <strong>”, min.label,”</strong></a>.</ul>”,
“<p>Click <a href=’https://app.displayr.com/Dashboard?id=53c67902-3f3f-4c06-bcfd-d6c977d0ef99′>here</a> for the full report.</p>”,
“<p>Kind regards,<br />Tim</p>”)
The following email will be generated.
You can find more information on basic HTML styling options at https://www.w3schools.com/html/html_styles.asp.
Comments
Comments are moderated to ensure respect towards the author and to prevent spam or self-promotion. Your comment may be edited, rejected, or approved based on these criteria. By commenting, you accept these terms and take responsibility for your contributions.
Disclaimer
The views, opinions, data, and methodologies expressed above are those of the contributor(s) and do not necessarily reflect or represent the official policies, positions, or beliefs of Greenbook.
More from Tim Bock
Rotate Your Correspondence Analysis to Better Understand Your Brand Positioning
Tim Bock on utilizing correspondence analysis.
Data Visualization for Conjoint Analysis
Visualizations can summarize patterns that are commonly hidden in a simulator
What’s Better Than Two Pie Charts?
Bad visuals stress the need for charts to be interpretable in seconds
Using “Small Multiples” Visualizations for Big Success
Visualizing data can be made easier by utilizing small charts for comparison and analysis
ARTICLES
Navigating the ‘Build vs Buy’ Decision in ResTech
As AI simplifies product-building, MR teams must weigh build vs. buy carefully, balancing governance, reliability, and research expertise.
Jiten Madia
Founder & CEO at flowres.io
Right-Size Your Restech
Restech can save time and money, but underuse leads to wasted value. Learn simple steps to maximize your tech investment and boost renewal success.
Z Johnson
Consultant at MRXplorer
Capitalize on Market Research's Tech-Forward Future
Discover the latest innovations and technologies in the restech space amidst industry-wide slowdowns with our market research website.
John Bird
Executive Vice President at Infotools
The Evolution of B2C Consumer Segmentation in the Digital Age
Consumer segmentation has evolved from traditional demographic methods to more advanced techniques in the digital age, driven by vast data availabilit...

Sign Up for
Updates
Get content that matters, written by top insights industry experts, delivered right to your inbox.