Categories
Developing and Testing Your Design Thinking Ideas (Part 4)
Taking your best ideas from paper to prototype.
The last three Monthly Dose of Design articles have discussed what Design Thinking (DT) is, what it means for, and how it can be used by, market researchers and discussed DT’s Define and Develop phases.
In the last installment of our Design Thinking series, this month we’ll discuss DT’s Deliver phase. By now, you’ll have clearly defined the design problem you want to solve, formulated a ‘How Might We’ statement to frame how you’ll solve it, and created ideas about how to solve your design problem. Now you’ll prototype and test the best idea.
What is the Deliver phase?
The Deliver phase is where you turn your best ideas about how to solve your design problem into a prototype (a rough, preliminary form of the product or service that’ll solve your design problem). However, this isn’t your final output. DT is an iterative process where you’ll keep refining your prototype based on feedback
This is the only DT stage where Designers take the lead. However, as you’ll soon see, a prototype can be built in many ways. And most of them are simple from a design perspective.
What makes a good prototype?
Prototyping’s goal is to develop a rough example to 1) test quickly and 2) learn from its failures or successes. Validated learnings allow you to improve the prototype quickly and efficiently, whilst still in its early stages. This means your prototype must be:
- Easily modifiable
Changing your prototype quickly and testing it again is key to success. But having an easily modifiable prototype means you can include new ideas and for those to be re-tested - Quick to produce
You don’t want to spend a long time developing your prototype, as it’ll most likely be re-developed as the process continues. Instead of spending time on fine details, the goal is to get a general idea across and get feedback. - Cheap to produce
You don’t want to spend lots of money developing your prototype either, as it’ll likely change. Additionally, cheaper prototypes are easier to discard to make way for new ideas. - Easily discardable
Don’t be afraid to discard your prototype, better solutions can appear during the Deliver process. Not falling in love with a single idea and being able to move on to better options is key to success.
What kind of prototypes are there?
Prototyping has many mediums. However, it’s best to pick the most appropriate medium for your situation. Here are five examples to choose from:
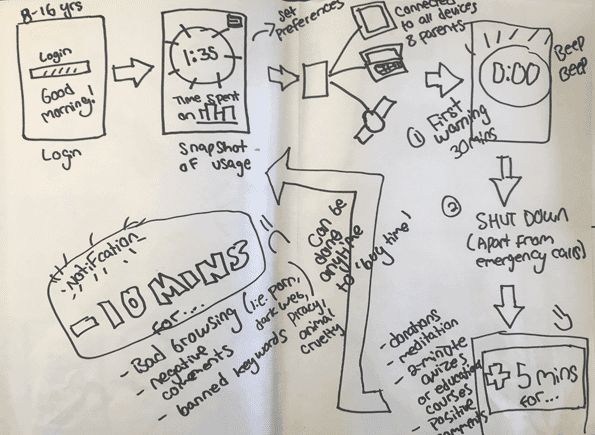
Sketches and diagrams
These are drawings that visualize your prototype and how it works. Keep them minimal and simple, so your user understands exactly what it is. Sketches and diagrams can help understand how your prototype works.

Photo by Samuel Mann via Flickr
Paper Interfaces
These are paper drawings that resemble the same dimensions you’re designing for. These can be used as the initial prototype for digital solutions e.g. apps. Paper Interfaces allow you to test the user flow and allow for multiple versions, which you can change between.
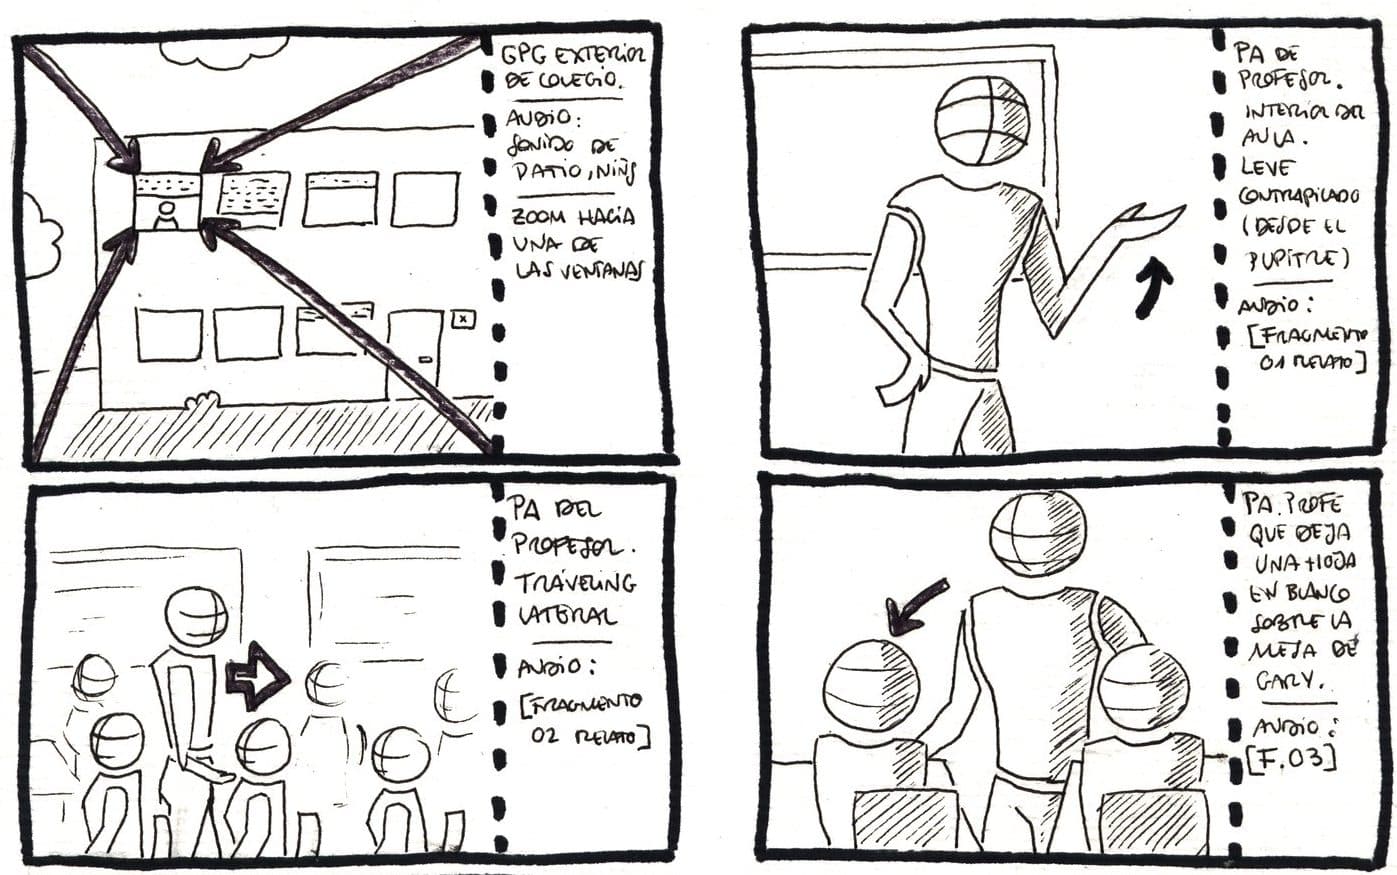
Photo by Art Tech via flickr
Storyboards
A storyboard is a visual sequence of how you want to show your product. It breaks downs the presented process into steps and this helps the user visualize the journey. Storyboards are a sequence of sketches showing how your prototype will be used.
Videos
Video can be a recording or reproduction of moving visual images. Videos allow your users to see your prototype in action. This is appropriate for lots of different solutions ranging from digital to service.
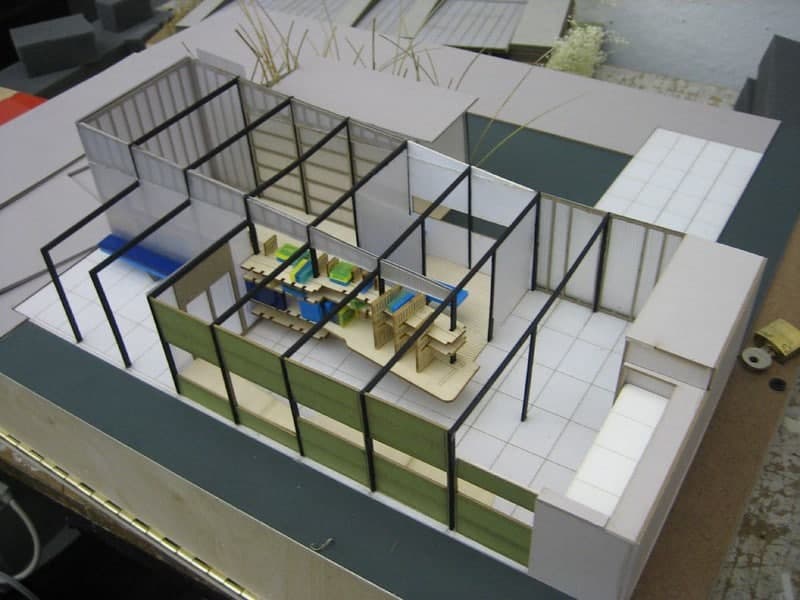
Photo by Joe Goldberg via flickr
Physical Models
A physical mock-up is a 3D visualization of your solution. This allows users to touch, smell, and physically evaluate your prototype.
How do you test and develop your prototype?
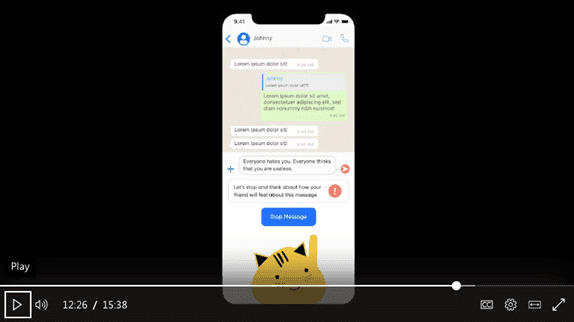
Once you’ve built your prototype, you must test and validate it. This is something you’ll be familiar with as researchers! So instead of discussing the techniques (which you’ll probably know!), here’s an example of the prototype for an anti-cyberbullying app that stops messages when profanity or hate is detected and was tested iteratively with relevant people (youths) via testing and learning.
The example below shows our high fidelity prototype, which was sent out for mass testing, however, before this, we started with low fidelity prototypes (sketches and paper interfaces) to share ideas and improve upon.
Step 1: Getting a youth’s opinion
Youths told us that our initial prototype made them behave counterproductively. They felt they should be able to send a message if they wanted and any restrictions should be optional, not forced.
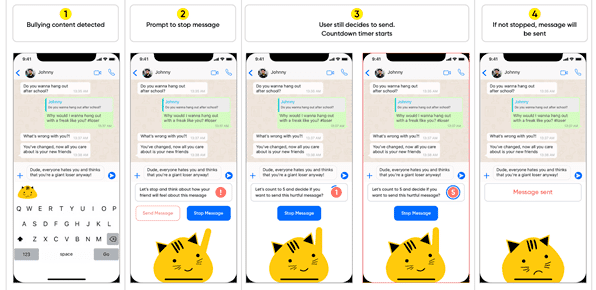
Step 2: Proposing new (hopefully better!) ideas
We proposed a “time delay function” to replace the message block function. This gave youths a choice of whether to send a message or not. If they chose to send it, the keyboard places the outgoing message on a five-second timer before sending it to give the youth time to reflect.
Step 3: We asked youths about the benefits of the “time delay function”
Youths agreed that the “time delay function” was less intrusive and made them aware of their actions.
This example demonstrates how testing can lead to new learnings and improved prototypes that are viable and practical through iterations.
Next month…
Next month we’ll look at a customized Market Research design thinking framework and how it plays towards market research’s strengths, with a look at how to turn research into a product.
Header Image: Kelly Sikkema, Unsplash
Comments
Comments are moderated to ensure respect towards the author and to prevent spam or self-promotion. Your comment may be edited, rejected, or approved based on these criteria. By commenting, you accept these terms and take responsibility for your contributions.
Disclaimer
The views, opinions, data, and methodologies expressed above are those of the contributor(s) and do not necessarily reflect or represent the official policies, positions, or beliefs of Greenbook.
More from Emma Galvin
The Fundamentals of Layout Design for Insights
Data visualization is easy with basic design layout design principles.
Innovation Management: Barriers to Innovation (Part Five)
The five main barriers to innovation.
Innovation Management: Disruptive Innovation (Part Four)
Disruptive innovation: What it is and why it’s important to MR.
Innovation Management: Breakthrough/Radical Innovation (Part Three)
Diving into breakthrough/radical innovation and how it applies to MR.
ARTICLES
Top in Research Methodologies
Future Trends Emerging in Mixed-Method Marketing Research
Explore the future of mixed-method marketing research, including AI, synthetic data, continuous insights, and evolving research workflows.
Ashley Shedlock
Content Producer at Greenbook
When Easy Becomes Empty: The Frictionless Feedback Fallacy
Making surveys easier doesn’t always improve insights. Discover why thoughtful feedback design balances convenience with meaningful, reflective respon...
Tarik Covington
Founder & Chief Strategist at Covariate. Human-Centered Insights
The Always-on Agency: How to Survive the Shift to Intelligence-Native Organizations
The insight agency model is under pressure. In an always-on world, success depends on becoming a decision partner, not just a supplier of research pro...
Hannah Mann
Founding Partner at Day One Strategy
The Ambiguity of Frequent Survey Participation: Is “Hyperactivity” a Signal of Professional Fraud?
Learn how to identify engaged respondents, detect bad actors, and improve data quality for more reliable research outcomes.
Sebastian Berger
Head of Science ReDem at Rep Data

Sign Up for
Updates
Get content that matters, written by top insights industry experts, delivered right to your inbox.