Categories
Forces of Change: How Technology and Apps are Supporting Consumers in a Post-COVID World
Are people using the same apps they turned to during lockdown?
Forces of Change is a multi-disciplinary collaboration between multiple industry leaders to combine research and provide a complete picture of the important changes impacting brands and their relationships with consumers. Based on research conducted in April of 2020, the report highlights some key and current trends, many of which will persist beyond COVID-19. The complete report is available for download here.
What are the new “norms” for how consumer behaviour has changed?
Pre-COVID most of us lived a “normal” life: wake up, send the kids to school, go to work, meetings, go to a restaurant for dinner with close family and friends…
As of the end of March 2020, all this changed, and our lives flipped 180 degrees. Nothing was “normal” anymore. The pandemic and the stay-at-home orders meant that we had to find a new norm, a new way of living. Schools were closed, office workers dismissed to work from home, holidays canceled, and families were separated with no prospect of meeting up soon.
The physical world as we knew it suddenly started to vanish. Technology and more specifically apps started to replace many of the things we do. Many of our day to day activities would have been impossible without the aid of apps.
This is why at Embee we decided to look at how Apps Tell the Story about our new normality, about the new ways of working, keeping ourselves entertained, staying in touch with family and friends, shopping, and staying healthy. Utilizing behavioural data from our US mobile panel, we analysed the differences in app usage across multiple categories to glean insights on the new consumer ways of living.
Business Communication App Usage
One of the first effects of the Pandemic was the shutting down of offices and closure of schools. Tens of millions of employees had to adapt to the new reality of working from home. And that did not happen without its challenges. We saw a big increase in the usage of apps that help setting up people’s new “offices.” Usage of e-Signature apps such as DocuSign and Adobe Fill & Sign spiked up in the first weeks of COVID.
But there was one kind of app that stood above all. Videoconferencing was the only way to conduct business meetings and talk to colleagues, clients, and prospects. Zoom quickly became the most used and most popular video communication app with customer growth of nearly 500% in the first month.
Zoom, together with rivals Microsoft Teams and Cisco Webex, have all seen a big surge in usage of their platforms since coronavirus lockdown measures were imposed earlier this year. As seen from the chart below, growth gradually slowed after May 2020 when things started to get settled and most people already adopted one of the platforms. Profits however have been soaring with Zoom reporting $186m net profit, mainly driven by high-end corporate clients.
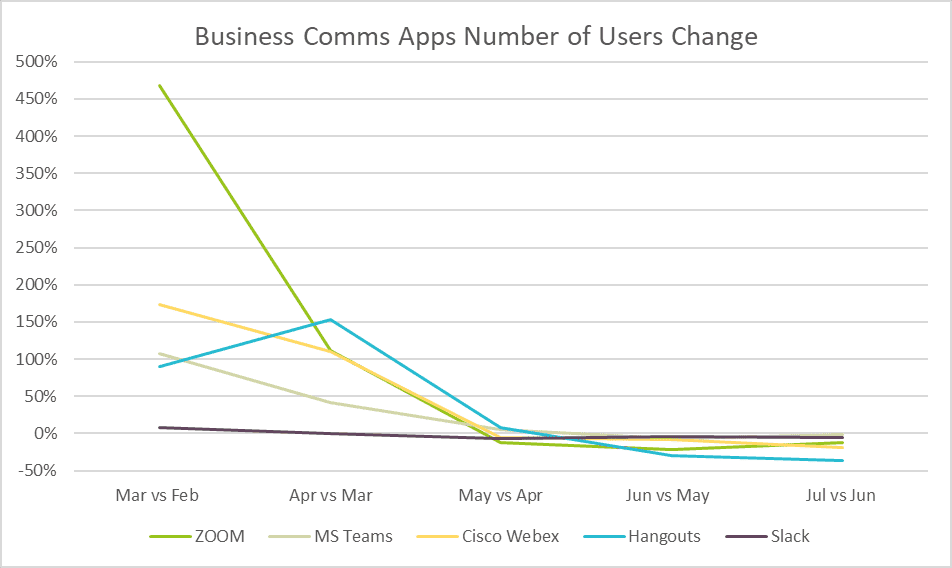
While Zoom helped businesses grow, there was a whole range of communication apps that also became essential to our daily lives. Keeping in touch with family and friends and checking up on them was vital after lockdown measures were imposed.
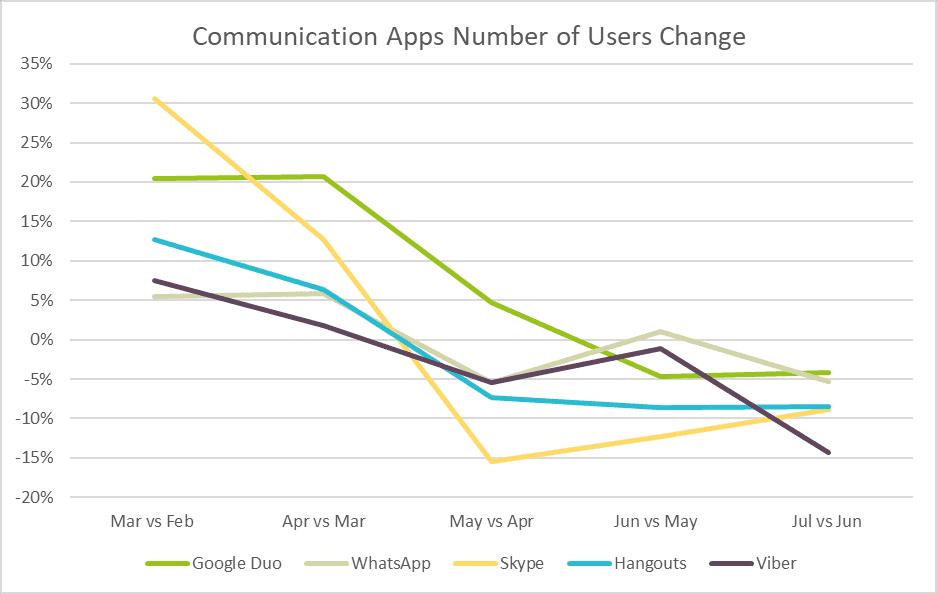
Communication App Usage
Although not at the same rate as the business communication category apps, the likes WhatsApp, Skype, and Viber increased their userbase a few folds in the first 2-3 months of the pandemic. What is interesting to observe in the chart below is that after May, some of those platforms not only slowed down their exponential growth but started losing some of their users. This coincides with the relaxation of the stay-at-home orders in late April/ early May when the majority of the states lifted their lockdown and allowed some movement of people again.
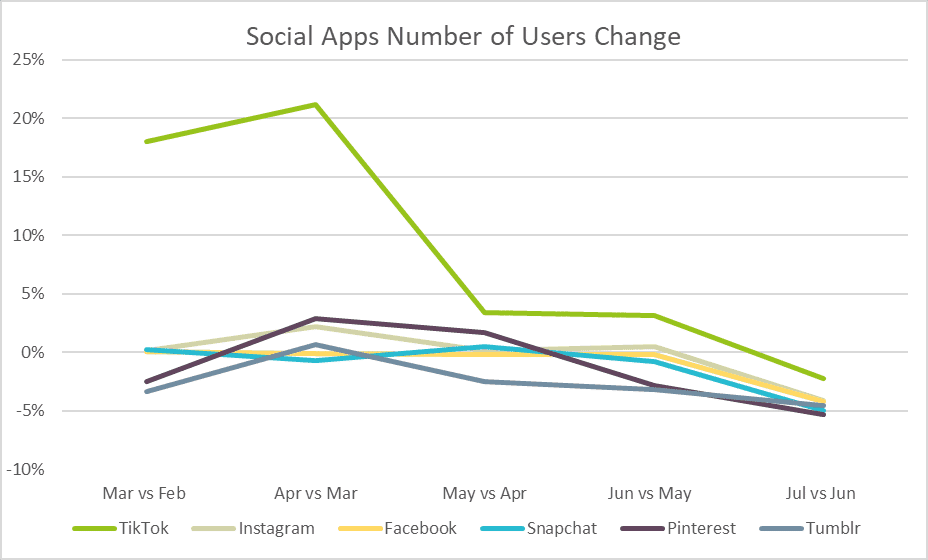
Social Media App Usage
While analysing the communication app category, we also took a pick of what’s happening with social media. There has been a lot of media frenzy recently about the executive orders by President Trump, trying to shut down the new kid on the block – TikTok.
TikTok is fighting an effective ban after the Trump administration deemed its data storage and security a national security risk because the company’s parent company, ByteDance, is based in China. But with nearly 50 million daily active U.S. users, TikTok is becoming a social app favorite. We wanted to see what the real impact of TikTok app usage is.
As you can see in the chart below, TikTok did increase their audience in each consecutive month for the first half of this year – more than any of their competitors – and then in July, when Trump started talking about an upcoming possible ban, the app usage had a small dip for the first time.
This is certainly a category to keep an eye on, as the war for advertising dollars is gearing up. If interested to read more check some of the blogs by Anand Ramanathan talking about the dynamics of shifting ad spend and the competition between the main players.
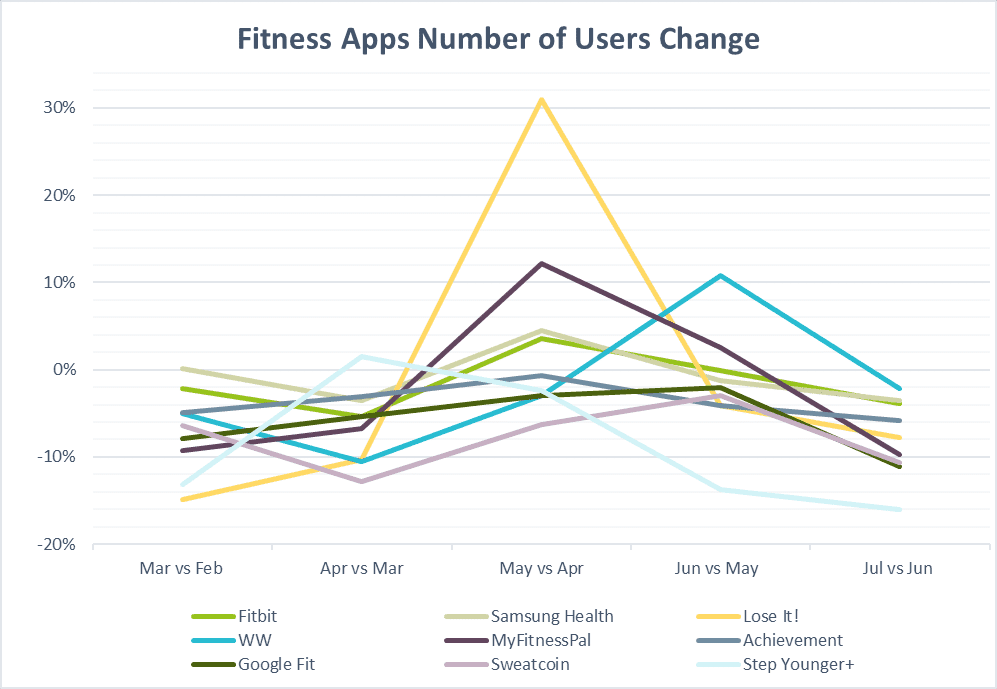
Health and Fitness Apps
While the Coronavirus may have brought a positive impact to some businesses, many others struggled or had to shut down completely. So naturally, we were very curious to see how people stayed healthy with the help of apps during those weeks and months of lockdown.
Take a look at the picture below. It tells a really interesting story. During February and March the people were still visiting gyms and calorie-counting apps were keeping a steady user base with some small wins or losses. However, as soon as the doors of the gyms and fitness centres were closed, we saw a big increase in health apps usage during April and May. In June the exponential growth continued, although not as big as the first couple of months of lockdown. And then … July came. Stay-at-home measures were lifted, people slowly returned to normality, which led to a drop in the use of those health/fitness apps by up to 20%.
The stay-at-home reality has driven people to spend more time on their mobile devices than ever before. No one can say for sure if those changes will have a permanent effect or whether it is just a temporary influx. One thing is for sure though – consumer behaviour has changed. Many brands will see increased pressure and demands from new customers while others will have to evaluate the new landscape to find out how best their services fit with the new norms.
The New Consumer
Consumers will continue to use their mobile devices to engage, purchase, or stay informed from a wide variety of product verticals and brands ranging from eCommerce and health & wellness to education and entertainment. Mobile user engagement is at an all-time high and the opportunity for growth, for brands, advertisers, and affiliates, has never been so prominent.
Read the full report
On a personal level, it has been very rewarding to be part of the Forces of Change research team.
Authored by:
Kos Vankov
Embee Mobile
Sincere appreciation goes to BuzzBack, Consensus Point, Converseon, Embee Mobile, Panoramix Global, and Gen2 Advisors for their effort and dedication to making this work available to you. There was also generous support provided by Greenbook, Blue Ridge Insights, and Prodege.
Comments
Comments are moderated to ensure respect towards the author and to prevent spam or self-promotion. Your comment may be edited, rejected, or approved based on these criteria. By commenting, you accept these terms and take responsibility for your contributions.
Disclaimer
The views, opinions, data, and methodologies expressed above are those of the contributor(s) and do not necessarily reflect or represent the official policies, positions, or beliefs of Greenbook.

Sign Up for
Updates
Get content that matters, written by top insights industry experts, delivered right to your inbox.