Categories
Intensity Isn’t a “Nice to Have” Feature of X-Data, it’s a Critical Predictive Indicator
Capturing intensity improves the accuracy of experience types by at least 60%.
Most insights professionals are tasked with distilling data to improve experiences that drive engagement and loyalty or minimize churn or both. But, ratings and sentiment scales leave experience leaders across all kinds of organizations with more questions than answers about how to respond. Whether you’re assessing users, patients, students, customers, or otherwise, these methods provide a benchmark for consumer perception, but they aren’t equipped to drive improvements because they lack critical context clues.
In order to understand the most common experiences, details and explanations are mined, analyzed, and interpreted from open-ended survey responses and social listening.
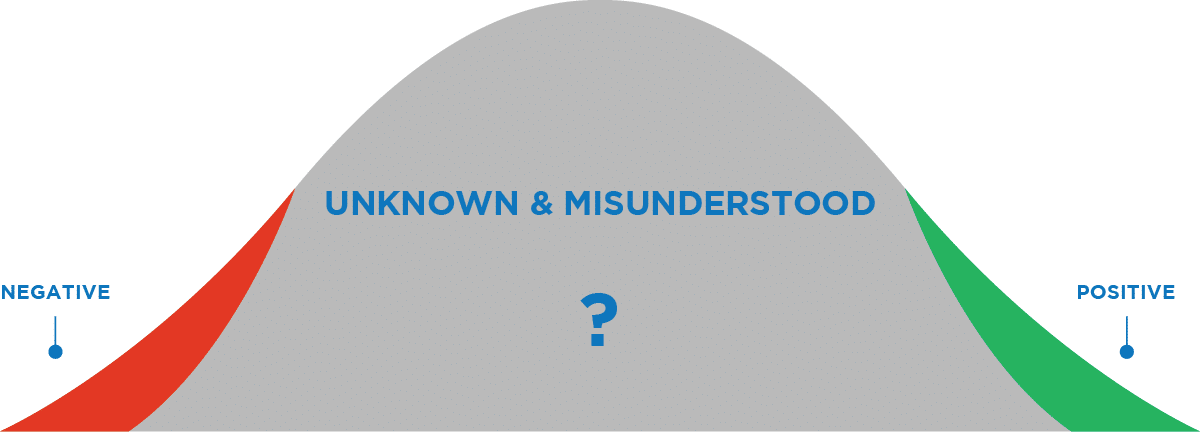
But, the experiences that are most easily improved often don’t compel people to share. Participation bends towards the extremes, leaving the majority largely unknown and misunderstood. As a result, both churn-reduction and loyalty initiatives are muzzled.
Even under the best of circumstances, when experiences can be categorized through these means, there are limitations on their ability to accurately fuel predictions when the intensity, or significance, of the experience, isn’t a part of the equation. Inherently, it is the significance of any experience that motivates our decisions.
The Study.
Respondents (1000+) were asked to identify two brands–one where they had a negative experience, and a second where they had a positive experience (in 2020). We then set out to compare:
- Consumer experience with popular brands, as a whole and in recent encounters (Morphii® capture of experience type + intensity)
- An index of common behaviors resulting from brand interaction and their frequency.
- Behaviors:
-
- Provided a positive/negative rating,
- Shared a positive/negative experience,
- Recommended/Warned others,
- Repeated/Discontinued purchases; Frequencies:
- 1-2 times
- 3-4 times
- 5 or more times
- (Note: for the purpose of reporting, frequencies were conservatively tallied as 1, 3, and 5)
Experience vs. Experience + Intensity.
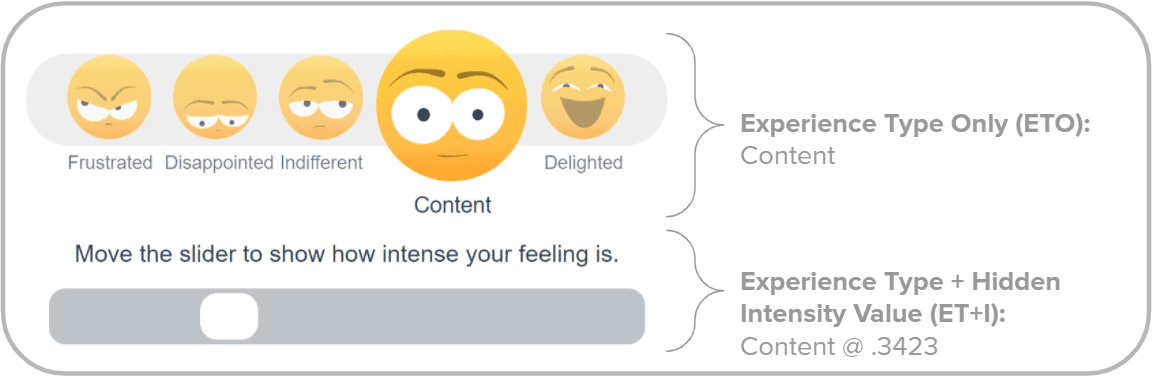
Today, many organizations are taking steps to get beyond simple positive/neutral/negative sentiment and better understand the nuances within various experience types or categories. Whether experiences are being distilled through AI interpretations of open-ended feedback or selected from a simple list of words or emojis, this qualitative data is the latest and greatest trend in experience management. While categorizing experiences is indeed a welcome departure from rating systems and scales that ask us to express ourselves in unnatural numeric intervals, this approach falls short of uncovering the significance, or intensity, of our experiences in terms of the ways they impact our decisions and behaviors. We looked at Morphii data for categorical experience type only (ETO) in comparison to categorical experience type + intensity (ET+I) to illustrate the power of intensity data in predicting behaviors.
Of course, all behavioral outcomes are not of equal consequence … some require more energy and result in greater impact. When dissecting the data, It was important to delineate between behaviors that are more passive (e.g., rating or sharing an experience) and behaviors that are more active (e.g., recommending or warning others, repeating or discontinuing purchase behaviors). Because correlations take the frequency of various behaviors into account, it’s also important to consider that it is probable that behavior like discontinuing purchases with a retailer is likely to only happen once.
Findings.
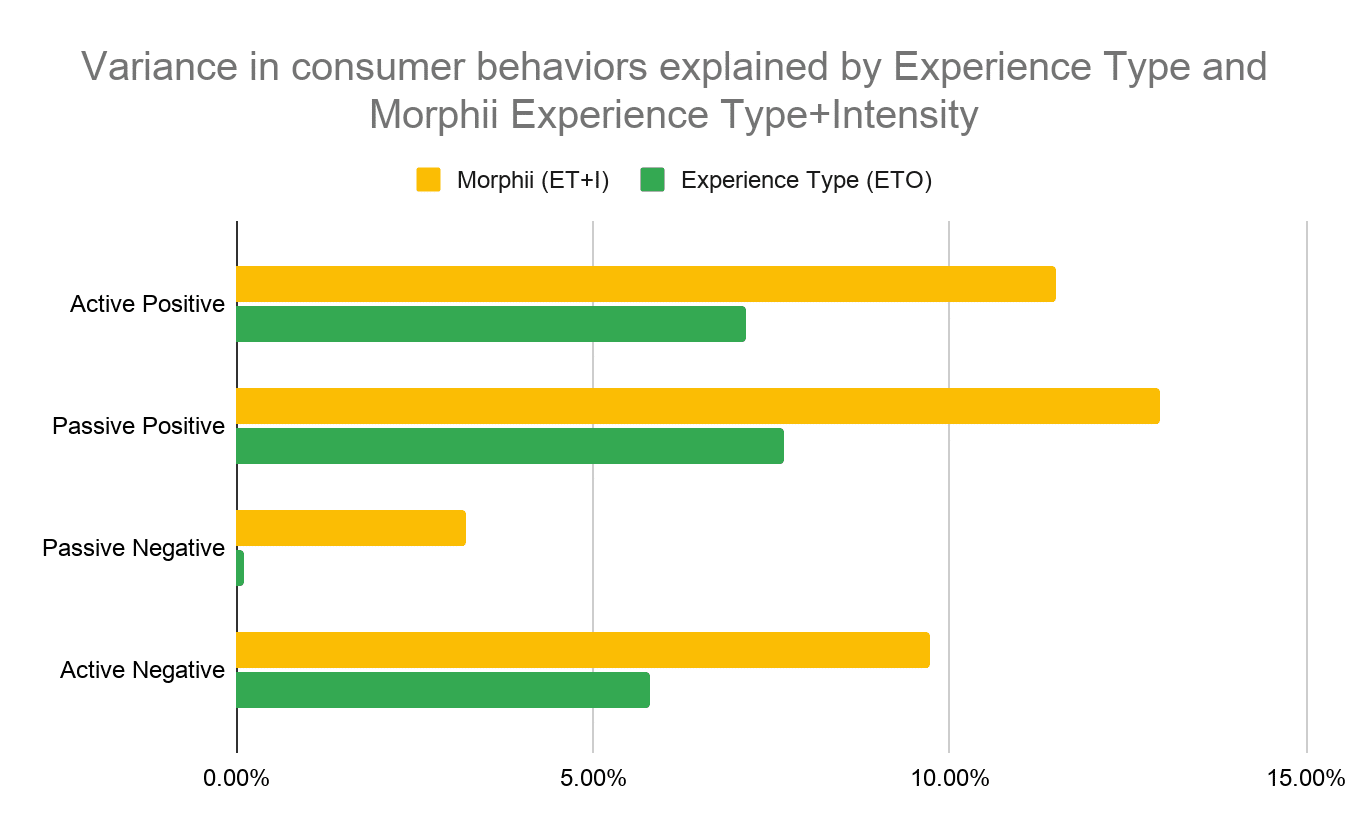
Positive Experiences & Positive Behaviors: ET+I explained 61% more variance in active positive behaviors in comparison to ETO; and, in terms of passive positive behaviors, Morphii demonstrated a 68.9% improvement over ETO. Negative Experiences & Negative Behaviors: In terms of consumers’ passive negative behaviors, ET+I outperformed ETO— demonstrating 30.2x more variance.
This improvement is so dramatic because ETO has essentially zero correlation to negative behaviors – and, among this group, effective experience capture is almost entirely dependent on intensity. In explaining active negative behaviors, ET+I demonstrated a 67.6% improvement over ETO.
In looking at specific experiences, their intensity, and their correlation to the frequency and severity of behaviors, you see what you would expect – but notably what other methods aren’t as adept at uncovering: a) various experience types & intensities drive different kinds of behavior at varying levels of severity/importance; and, b) different frequencies of these behaviors– as experience types become more positive or negative, and as intensity elevates, behaviors become more severe and more frequent.
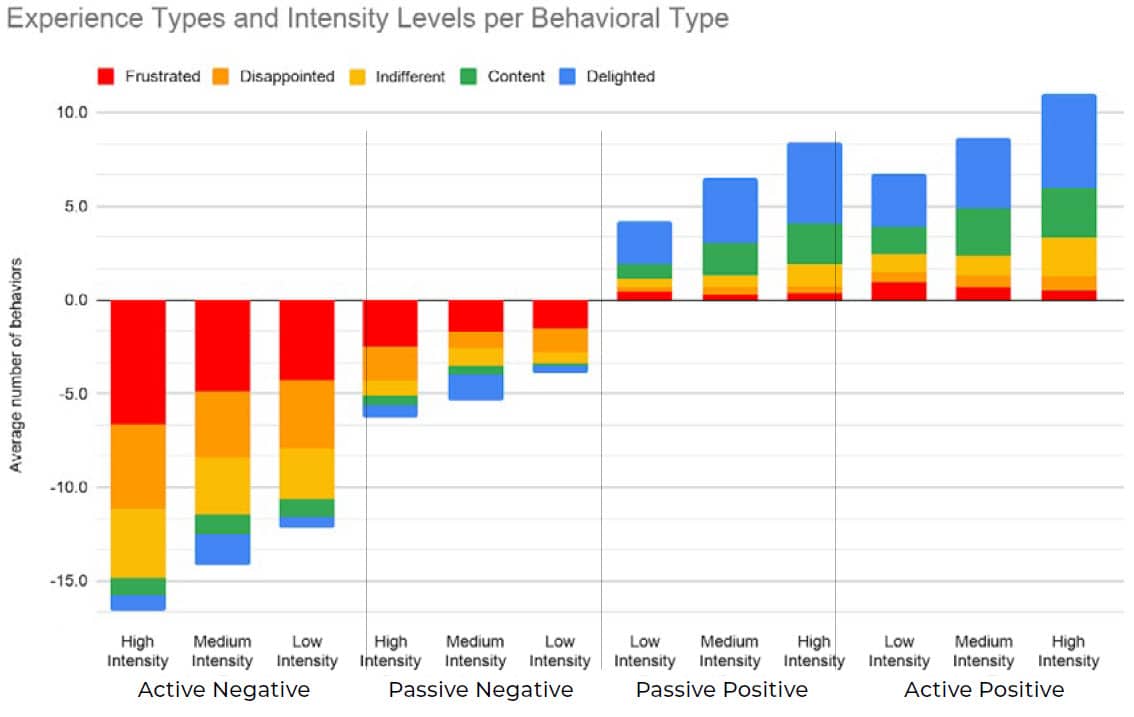
For example, all negative behaviors are more frequent when someone reports feeling Frustrated than when someone reports feeling Disappointed, and negative behaviors further increase as the intensity of Frustration escalates. Similarly, all positive behaviors are more frequent when someone reports feeling significantly Delighted in comparison to reporting Content. Finally, those who report being Indifferent demonstrate less correlation toward any behavior, positive or negative. Although those who are “intensely” Indifferent tend to trend toward negative behaviors over positive ones.
At a minimum, intensity improves the predictive accuracy of experience type; but, at its best, it is the driving force behind predicting behaviors. And, typically the behaviors most driven by intensity are also the most complicated to capture and understand.
Opportunity.
The reality is that only 20% of insights initiatives are resulting in tangible outcomes, and we have to do better (Gartner). Improving insights-driven outcomes begins with capturing and quantifying experiences in a more efficient and engaging way. In order to drive loyalty and reduce churn, we must derive actionable insights from more precise, self-reported data. What we have always known intuitively—and now have evidence to support— is that the intensity of our experiences matters.
On their face, consumer frustration and disappointment are daunting. But having intensity data that separates intensely negative experiences from more mild ones can change your perspective—creating an opportunity where there was once the only risk. After all, it’s arguable that provoking any feeling at all, is an improvement over consumer indifference. With Experience Type + Intensity data, you don’t have to imagine segmenting consumers who are salvageable from those who are too costly to retain – you can actually do it. … You don’t have to hope that “satisfaction” is breeding loyalty, you can measure the significance of an experience to understand if it truly elicits advocacy–reserving rewards for those who truly champion your brand.
Capturing Experience Type + Intensity using an engaging technology augments and affirms insights strategies with a new class of data, and users who interact with it (who are typically more complacent) tend to be inspired to tell you more in open feedback— 4x more, in fact than when provoked using a star rating.
Comments
Comments are moderated to ensure respect towards the author and to prevent spam or self-promotion. Your comment may be edited, rejected, or approved based on these criteria. By commenting, you accept these terms and take responsibility for your contributions.
Disclaimer
The views, opinions, data, and methodologies expressed above are those of the contributor(s) and do not necessarily reflect or represent the official policies, positions, or beliefs of Greenbook.
ARTICLES
Top in Research Methodologies
When Easy Becomes Empty: The Frictionless Feedback Fallacy
Making surveys easier doesn’t always improve insights. Discover why thoughtful feedback design balances convenience with meaningful, reflective respon...
Tarik Covington
Founder & Chief Strategist at Covariate. Human-Centered Insights
The Always-on Agency: How to Survive the Shift to Intelligence-Native Organizations
The insight agency model is under pressure. In an always-on world, success depends on becoming a decision partner, not just a supplier of research pro...
Hannah Mann
Founding Partner at Day One Strategy
The Ambiguity of Frequent Survey Participation: Is “Hyperactivity” a Signal of Professional Fraud?
Learn how to identify engaged respondents, detect bad actors, and improve data quality for more reliable research outcomes.
Sebastian Berger
Head of Science ReDem at Rep Data
Ethical by Design: The Questions Every Mixed-Method Research Team Should Be Asking
Explore the ethical questions researchers should ask when combining surveys, interviews, AI analysis, synthetic data, and behavioral tracking in mixed...
Ashley Shedlock
Content Producer at Greenbook

Sign Up for
Updates
Get content that matters, written by top insights industry experts, delivered right to your inbox.