Categories
Paul DePodesta and the Power of Analytics
This article explores analytics, big data, and their impact in and outside of sports; and why the Browns are exploiting the power of data.
By Rudly Raphael
Statistics are much more than numbers. They drive major business decisions, engineering, and everyday life. They fuel testing of new medicine, protect our borders, push the Warriors to the NBA title, and even guide personal decisions, whether used consciously or not.
Over millennia, military leaders employed data and analysis to defeat enemies. Today, major business leaders all over the world employ the same methodology in delivering cherished goods and services. Even the world of sports and entertainment understands this aspect of modern business. For example, The Cleveland Browns recently made headlines by hiring Paul DePodesta, a former collegiate wide receiver, who rose to fame through a dramatization of Michael Lewis’ “Moneyball,” which chronicled his ability to use baseball statistics to aid the Oakland A’s in competing against better financed teams.
After moving to the NFL, the Cleveland Browns collected three championship trophies in their first 5 years in the league. Unfortunately, their performance slipped into mediocrity by the 70’s, and in subsequent eras, their lackluster performance continued. While the Browns have a history of making bad personnel decisions, the Browns tapped DePodesta not due to their situation, but rather out of the need for a guide in transforming their organization, and remaining competitive.
This article explores analytics, big data, and their impact in and outside of sports; and why the Browns joined countless organizations in exploiting the power of data.
The Analytics Machine Driving Modern Business
Analytics or business intelligence (BI) owes its substance to military intelligence and serves the same essential purpose. At every stage of a campaign, intelligence gives commanders a clear picture of battle with pros and cons of options. In business, leaders maintain a picture of operations and status, and the factors affecting outcome.
Before computer use in business, business intelligence primarily involved legal spying (like military spies). It began to mature by the 1800s when Richard Miller Devens wrote about a banker exploiting data to outperform competitors. In the 1950s, commercial computers hit markets, and modern business intelligence officially began. Hans Peter Luhn, an IBM researcher and leading computer scientist, created foundational business analytics systems, and laid the groundwork for analyzing and distributing documents. Some consider him the father of BI.
Business intelligence advancement developed parallel to computer technology development, exploiting every viable tool available to private organizations and individuals. Through various innovations, its main resources actually remained the same: big data, analysis applications, and statistical theory. Cultural shifts within business led to more and deeper business intelligence use. Business, like sports, possesses a macho culture with great minds exploiting their instincts and natural talent. This environment wrestled with accepting analysis, however, the cold, hard facts won them over, cementing and advancing its role.
Table 1: Business Intelligence Earnings Growth 2008 – 2013
(Billions USD)
| Organization | 2008 | 2009 | 2010 | 2011 | 2012 | 2013 |
| SAP | 2.105 | 2.066 | 2.413 | 2.883 | 2.902 | 3.057 |
| Oracle | 1.285 | 1.350 | 1.646 | 1.913 | 1.952 | 1.994 |
| IBM | 0.997 | 1.136 | 1.222 | 1.477 | 1.735 | 1.820 |
| SAS | 1.287 | 1.325 | 1.386 | 1.542 | 1.600 | 1.696 |
| Microsoft | 0.681 | 0.739 | 0.913 | 1.059 | 1.190 | 1.379 |
Source: Gartner 2013, 2014
Analytics In Action
Virtually every industry employs analytics including, but not limited to the following examples:
- As it relates to marketing and advertising, analytics determine the effect of campaigns and channels including their ROI.
- Analytics is widely used in politics to determine the best way to access, motivate and interact with political supporters.
- Analytics is widely used in the military to understand the enemy or to go as far as anticipating or counter attacks. Some military applications even analyze an enemy’s facial expressions.
- In medicine, along with improving profits and reducing waste, data predicts epidemics, aids in curing disease, and aids in avoiding preventable deaths.
IBM surveyed over 1,000 international executives from 67 countries. The survey reveals 63% of organizations achieve a positive return on analytics investment within one year, and 26% realize it in as little as 6 months. Businesses across sectors clearly recognize the transformative effect of analytics with customer service, operations efficiency, and financial or risk management as the main areas of application. Out of those surveyed, 49% of organizations report employing big data exceeded their expectations for returns, and 40% of organizations (up from 25% in 2013) focus analytics on operations.
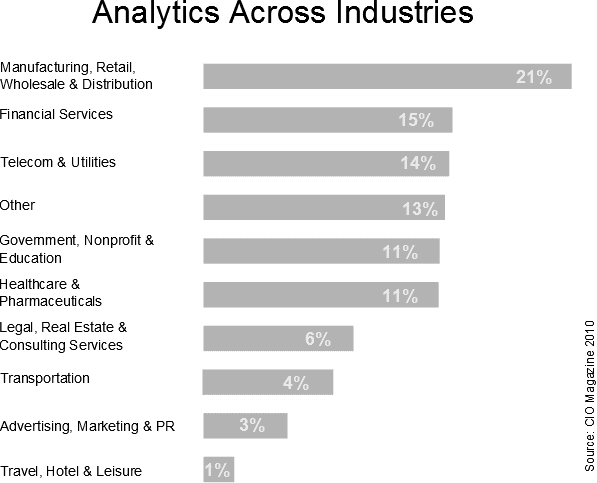
CIO magazine surveyed over 300 professionals, and 65% credited analytics with driving business process change. These professionals represent manufacturing, financial services, telecoms, government, nonprofits, and healthcare. 100% of respondents stated their organization used analytics; furthermore, 57% claimed their organization would increase analytics spending.
Research has shown that more than 80% of the world’s major business leaders pursue big data projects to remain competitive.
Case Study: Nate Silver
Nate Silver, a statistician, skyrocketed to fame on the back of his baseball and election analysis. He initially became known for his PECOTA system, a statistical forecasting system for major league baseball player performance. His system grabbed the attention of major sports media entities and publications such as ESPN, the New York Times, and Sports Illustrated. Others recognized Silver’s talent after he correctly predicted 49 out of 50 states in the 2008 US presidential election. This earned him a spot on Time’s “100 Most Influential People” list. Four years later, he correctly predicted all 50 states in the 2012 election. 12
Quality data and analysis form the foundation of powerful analytics. The data must tell a story, and provide all the information needed to spot trends or support critical decisions. Any other data offers no insight. The size of big data proves its weakness and strength. Analysts unfortunately spend more time aggregating a sea of data than analyzing it. Many organizations also realize, like sports organizations, data analysts must partner with experts in the field to achieve quality analysis.
Rebuilding Cleveland’s Machine
Analytics might not get the Browns to the superbowl anytime soon, however, the organization has a different goal. They simply want to leverage an excellent resource in tuning operations, a move the NBA, MLB, and many other major leagues agree works. Many know about the general results of these efforts, but much of it remains hidden like the trade secrets of successful businesses.
Analytics on the Field
The Red Sox exploited analytics and emphasized on-base percentage, something which proved critical to developing a championship contender, and which currently fuels huge salaries. Nor (number of walks) caused baseball to reevaluate hitters and pitchers, and control the metric given its value both in prevention and draw. Analytics also caused a drop in base stealing attempts, which fell by 30% between 1993 and 2013. The NBA flocked to the 3-point corner shot on the strength of its performance in analysis, increasing the attempts by over 100 percent. Analysis also revealed optimal lineups and tactics.
Analytics offers more than game actions, and extends to player health. Many organizations use data to monitor, prevent, and manage injuries.
The Team
Data influences picks and coach selection, and goes even deeper. In football, a single statistic can be created to encapsulate the performance of a player, merging quantitative and qualitative characteristics. This aids in building a well-designed, devastating team instead of assembling a pack of men or women who display a bit of talent.
Analytics also goes further than the field and into more practical aspects of an organization’s business performance including areas like ticket sales and fan engagement. Data aids in reaching fans, supporters, and investors.
Cleveland’s Future
Ultimately, analytics make the Browns a stronger organization with better performance, a firmer foundation, and enhanced longevity in a competitive space. Despite this reality, a certain amount of reluctance exists in the NFL due to the very nature of the game. Many consider football too complex for analysis. Box score statistics accurately describe 90% of a baseball game compared with 40% of a football game, however, simple adjustments overcome this such as placing chips and sensors in football pads to gather data, or placing analysis equipment on the field (as in basketball and baseball).
The financial and cultural dynamic in the NFL also affects attitudes. The longtime owners of the NFL are extremely risk-averse, and along with owners who fear change, many coaches and managers also feel threatened. They fail to understand analytics as support for their decisions rather than a replacement for them.
Source
- http://www.enterpriseappstoday.com/business-intelligence/business-intelligence-101-a-briefhistory.html
- http://www.investopedia.com/ask/answers/033015/what-are-historical-origins-business-intelligence.asp
- http://www.businesscomputingworld.co.uk/the-history-of-business-intelligence-infographic/
- http://www.novemba.de/wp-content/uploads/IBV_Studie_Analytics_The-speed-advantage.pdf
- http://mkting.cio.com/pdf/<CIOBIAnalytics_May2010-FINAL.pdf
- https://en.wikipedia.org/wiki/Nate_Silver
- http://www.itproportal.com/2015/03/01/problem-with-data-analytics-what-2015-holds/
- http://www.cio.com/article/2902297/data-analytics/8-ways-analytics-are-changing-pro-sports.html#slide9
- http://espn.go.com/espn/story/_/id/10476210/nba-mlb-embrace-analytics-nfl-reluctant-espn-magazine
- http://www.sas.com/content/dam/SAS/en_us/doc/whitepaper2/iia-analytics-in-sports-106993.pdf
Comments
Comments are moderated to ensure respect towards the author and to prevent spam or self-promotion. Your comment may be edited, rejected, or approved based on these criteria. By commenting, you accept these terms and take responsibility for your contributions.
Disclaimer
The views, opinions, data, and methodologies expressed above are those of the contributor(s) and do not necessarily reflect or represent the official policies, positions, or beliefs of Greenbook.
More from Greenbook
Benchmarking Essentials: Using Online Reviews to Drive Business Growth
Explore the insights from online reviews.
‘Tis the Season to Donate: Consumer and Corporate Sentiments Around Giving Season
Learn corporate and consumer sentiment about this giving season.
How to Succeed With Insights in 2022
Expand your access to insights and bring consumers to the heart of your organization.
Consumer Centricity: A Fireside Chat with Pepsi Lipton
Learn how to turn consumer-centric vision into action.
ARTICLES
Top in Data Science
Ultra-Processed Data: Are We Heading for an Insights Health Crisis?
Learn the risks of synthetic data and why high-quality human data remains essential for trusted market research insights.
Phil Sutcliffe
Managing Partner at Nexxt Intelligence
Synthetic Data: A White Paper on Fundamentals
Synthetic data is a powerful research tool when used wisely. Learn where it delivers value, where human research remains essential, and how to use it ...
Vijay Raj
Independent Consultant at Incite Growth
Improving Data Quality with Rapport and Relationship-Building
Online research chased speed over quality. Discover why rapport, trust, and legitimacy drive stronger engagement and better data than quick fixes.
Nitika Chaudhary
Co-Founder/CEO at Survey Sherpa
Partner Content
The Research Stack Has a New Layer: Synthetic. Here's Where It Actually Belongs.
Synthetic panels built on validated human data reduce early-stage testing waste, helping teams extend the value of every research dollar.
Ali Henriques
Head of Market Research at Qualtrics

Sign Up for
Updates
Get content that matters, written by top insights industry experts, delivered right to your inbox.