Categories
The NPS Recoding Trick: The Smart Way to Compute the Net Promoter Score
Tim Bock shares a smarter way of calculating the Net Promoter Score.
By Tim Bock
The Net Promoter Score is most people’s go-to measure for evaluating companies, brands, and business units. However, the standard way of computing the NPS – subtract the promoters from the detractors – is a bit of a pain. And, in most apps, you cannot use it in stat tests, so you are never really sure when the NPS moves whether it reflects a change in performance, or just some random noise in the data.
The standard way of computing the NPS
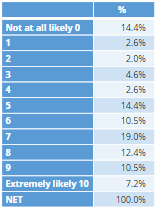
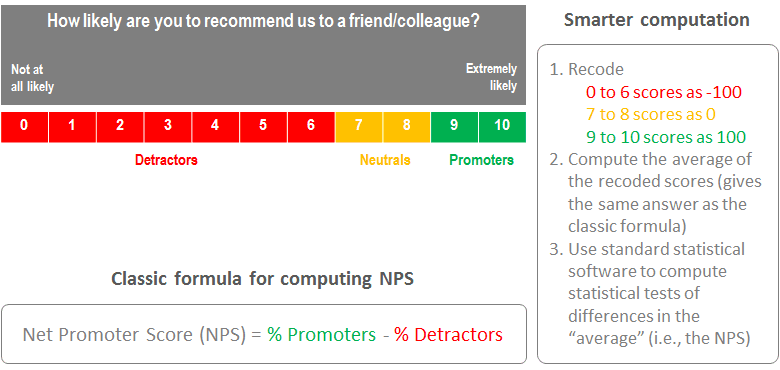
The table to the right shows data for Apple. Fourteen (14.4%) said they were Not at all likely to recommend Apple, 2.6% gave a rating of 1 out of 10, 2.0% gave a rating of 2, etc. If we add up the first seven categories (0 through 6), 51% of people in this data set are Detractors. Adding up categories 7 and 8 gives us 31% Neutrals, and then the remaining 18% are Promoters. So, in this data set, Apple’s NPS is -33.3, which is not great. (Among Apple customers, the NPS is much higher.)
A smarter way
The table below shows the raw data for the 153 people in the data set. The actual ratings, out of 11, are shown in the Recommend: Apple column. The second column shows the recoded data, where the original values are replaced by new values. The trick is to replace values of 0 through 6 with -100, values of 7 or 8 become 0, and values of 9 or 10 get a new value of 100. The column on the right shows the recoded data.
Why is this recoding clever? Once you have recoded the data this way, you can compute the NPS by computing the average, and you get exactly the same answer as you do when using the standard way.
Why the smarter way is so much smarter
The genius of the smarter way is that we can now compute NPS using any analysis app that is able to compute an average. For example, I have used the multiway table feature in Displayr to compute the NPS for Apple by age and gender, by just selecting the three variable (age, gender, and the recoded NPS variable).
The multiway table is created using Insert > More > Tables > Multiway Table.
Doing this with your own data using Displayr
The fastest way to do do this is to start using Displayr, and then:
- Import a data set: Home > Data Set (Data). If you want to play around with a live example where the data is already in Displayr, click here.
- Drag the variable containing the likelihood to recommend data from the Data tree onto the page, so that it creates a table (like the first table in this post)
- Select the table, and select Data Manipulation > Utilities (far right) > Compute > Net Promoter Score. This will add the NPS to the bottom of the table.
- (Optional) Select the variable (in the Data tree, bottom-left), and change the Structure to Numeric (in the Object Inspector on the right). This will mean that you only ever see the NPS, rather than seeing both the NPS and the percentages in each category.
Alternatively, if you want to do the calculations “by hand”:
- Import a data set: Home > Data Set (Data). If you want to play around with a live example where the data is already in Displayr, click here.
- Drag the variable containing the likelihood to recommend data from the Data tree onto the page, so that it creates a table (like the first table in this post).
- Select the variable in the Data tree.

Comments
Comments are moderated to ensure respect towards the author and to prevent spam or self-promotion. Your comment may be edited, rejected, or approved based on these criteria. By commenting, you accept these terms and take responsibility for your contributions.
Disclaimer
The views, opinions, data, and methodologies expressed above are those of the contributor(s) and do not necessarily reflect or represent the official policies, positions, or beliefs of Greenbook.
More from Tim Bock
Rotate Your Correspondence Analysis to Better Understand Your Brand Positioning
Tim Bock on utilizing correspondence analysis.
Data Visualization for Conjoint Analysis
Visualizations can summarize patterns that are commonly hidden in a simulator
What’s Better Than Two Pie Charts?
Bad visuals stress the need for charts to be interpretable in seconds
Using “Small Multiples” Visualizations for Big Success
Visualizing data can be made easier by utilizing small charts for comparison and analysis
ARTICLES
Top in Research Methodologies
Future Trends Emerging in Mixed-Method Marketing Research
Explore the future of mixed-method marketing research, including AI, synthetic data, continuous insights, and evolving research workflows.
Ashley Shedlock
Content Producer at Greenbook
When Easy Becomes Empty: The Frictionless Feedback Fallacy
Making surveys easier doesn’t always improve insights. Discover why thoughtful feedback design balances convenience with meaningful, reflective respon...
Tarik Covington
Founder & Chief Strategist at Covariate. Human-Centered Insights
The Always-on Agency: How to Survive the Shift to Intelligence-Native Organizations
The insight agency model is under pressure. In an always-on world, success depends on becoming a decision partner, not just a supplier of research pro...
Hannah Mann
Founding Partner at Day One Strategy
The Ambiguity of Frequent Survey Participation: Is “Hyperactivity” a Signal of Professional Fraud?
Learn how to identify engaged respondents, detect bad actors, and improve data quality for more reliable research outcomes.
Sebastian Berger
Head of Science ReDem at Rep Data

Sign Up for
Updates
Get content that matters, written by top insights industry experts, delivered right to your inbox.