Categories
How to Improve Your Survey Data Quality
Data quality control is at the heart of good information The most trusted market research technique for product feature and pricing optimization is called conjoint analysis (see figure 1). Conjoint…
Data quality control is at the heart of good information
The most trusted market research technique for product feature and pricing optimization is called conjoint analysis (see figure 1). Conjoint analysis is a survey-based research technique, in which data is collected from hundreds of survey takers. The survey takers go through an exercise called ‘choice task,’ or conjoint exercise in which they make selections among potential available products or services.
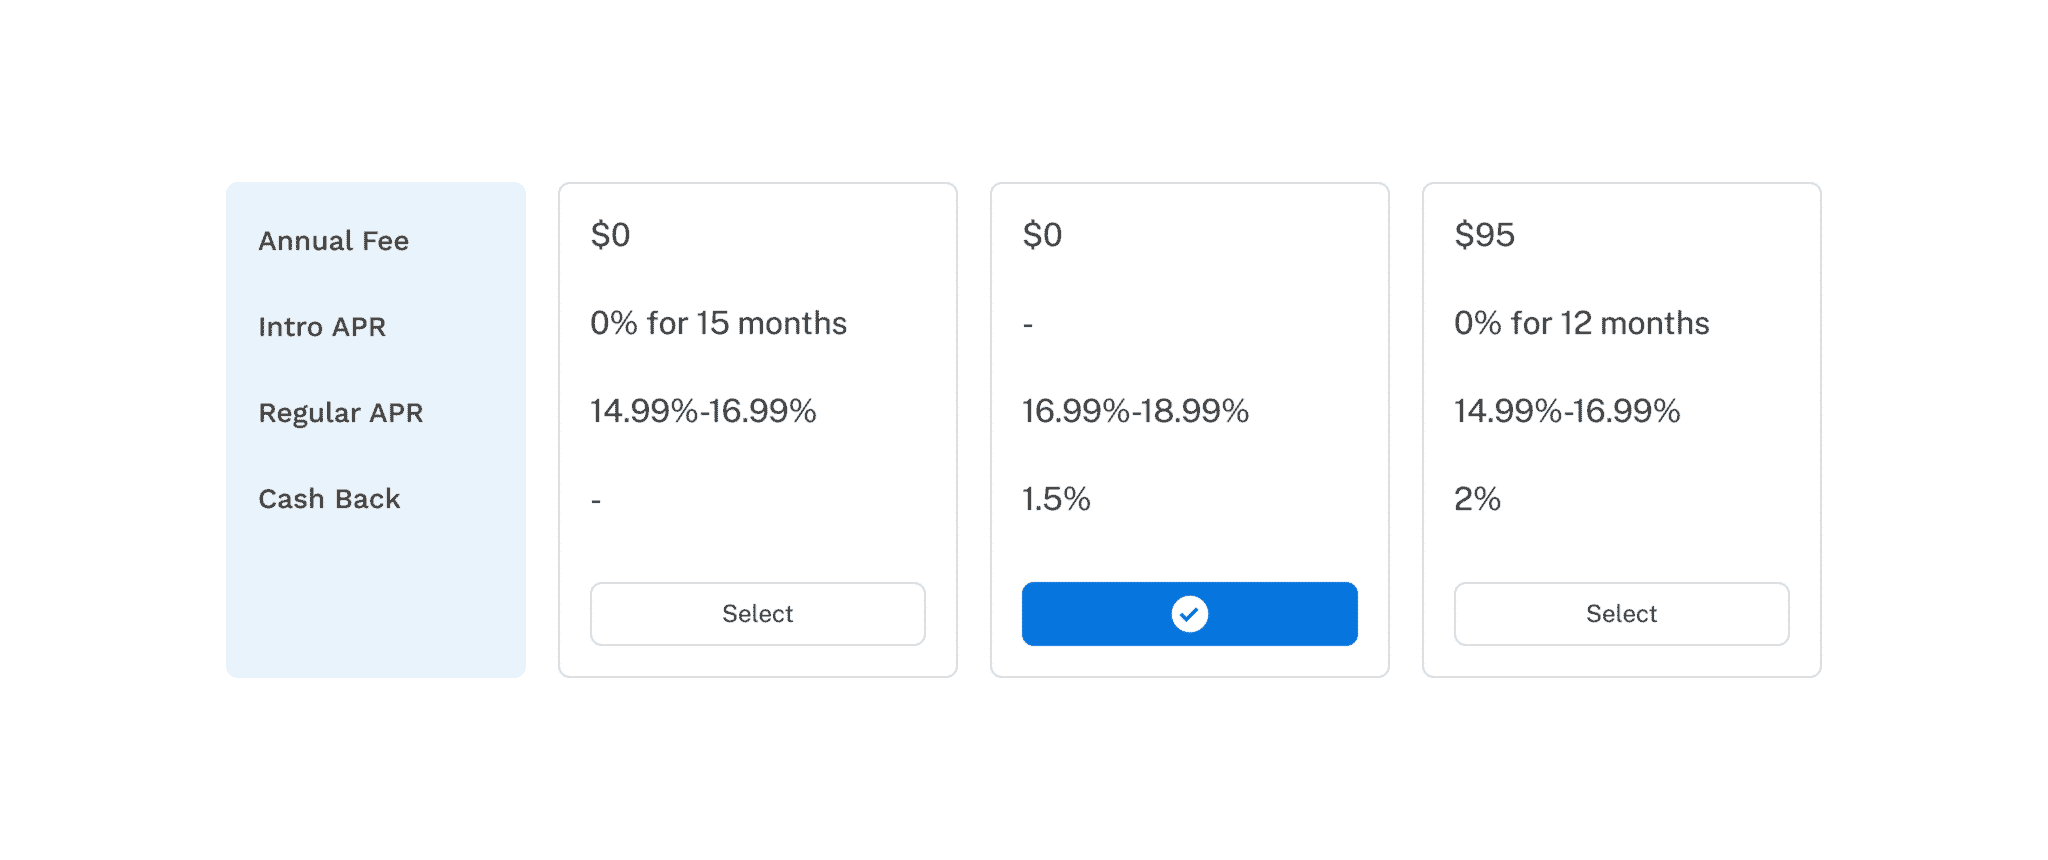
Example of a conjoint analysis (Figure 1)
The quality of responses determines the quality of the results
When respondents carefully consider the products before making the selection, the researcher can be confident that the data is high quality reflecting the survey taker’s true opinion. But how do we know that we can trust the data? What if survey takers just clicked through the survey quickly and randomly to finish the survey? If they were to do that – the data would be useless and you, as a researcher and your client, would have wasted a lot of money for poor quality data.
Luckily, there are a couple of ways to check the quality of your data. One good and common method is to check the completion time for the choice task. Most survey providers record the minutes it took for a survey taker to go through the choice exercises. A good rule of thumb is to find the median time across survey respondents and investigate those survey takers whose time was less than 40% of the median.
The Root Likelihood: another way to measure statistical fit
Another good way employs something called the Root Likelihood or RLH score. The Root Likelihood serves a similar role that R-squared does in regression: technically it tells you, for each survey respondent, the probability the respondent would have made the selections she made, given their preference, or “utility” scores).
How do you find survey responses that are poor quality?
The Root Likelihood method works like this: Let’s suppose that we show three product choices in a conjoint exercise. If we know nothing about preferences, we might say each of the three options has a one in three or 33% chance of being selected – the rate we get from random chance.
Because respondents do have preferences and we learn about survey takers’ preferences along the way, we calculate utility scores for each survey respondent. Using the survey respondent’s utilities and what’s called the logit equation, we can easily calculate the probability that a survey respondent would have picked each of the three product options shown to them.
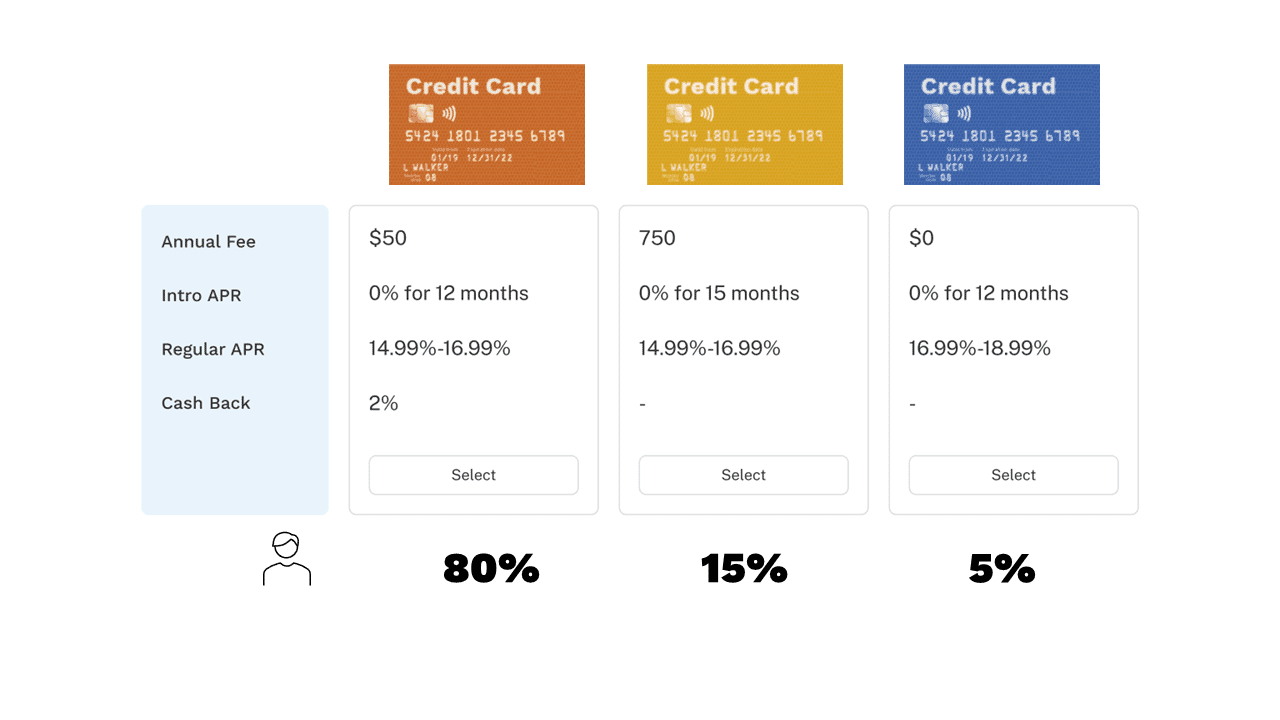
(Figure 2)
As an example, let’s assume that option A has an 80% probability of being selected, option B has 15% and option C has 5% (see figure 2). If the survey respondent did pick option A, their Root Likelihood score would be 0.8 – much different from the 33% chance probability (see figure 3).
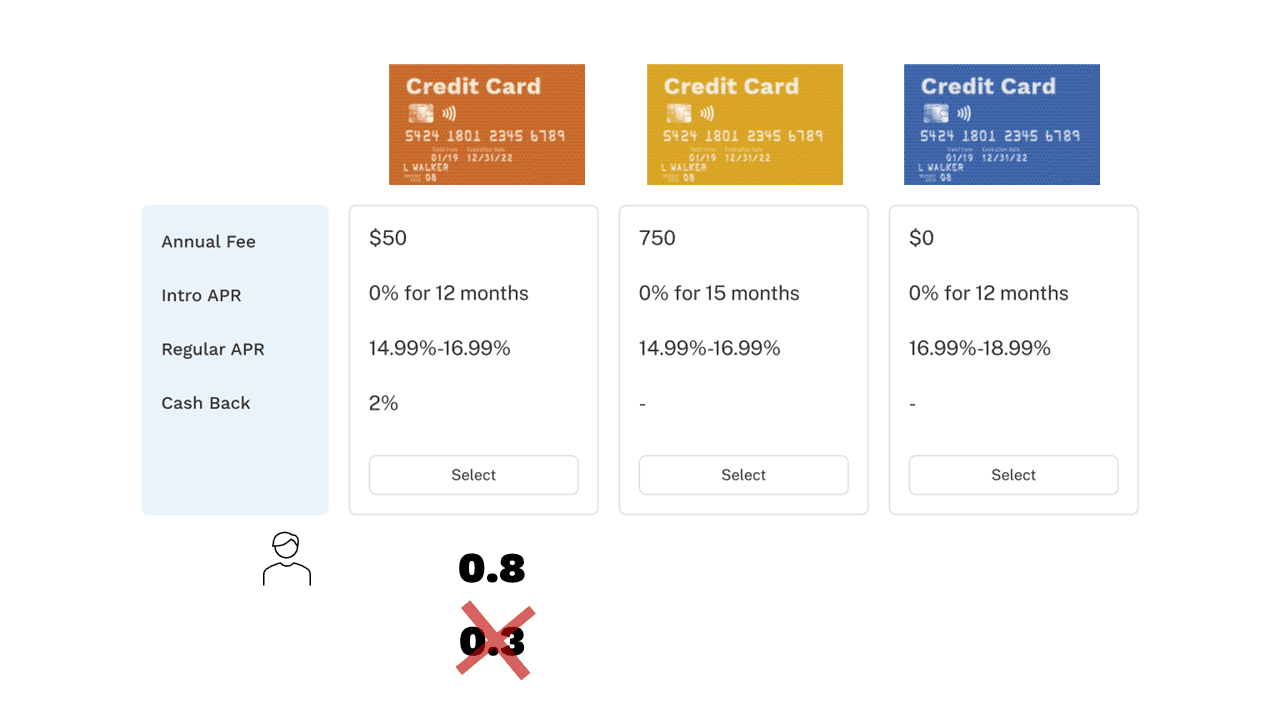
(Figure 3)
In a survey where the survey taker goes through several choice tasks, each with different product options and probabilities to be selected, the way to calculate the survey respondent’s Root Likelihood fit score takes a few extra steps. At the end of the several choice tasks, we calculate the geometric mean of the probabilities, which we call the respondent’s Root Likelihood score or fit metric.
With that technical background on Root Likelihood behind us, we can use it to recognize poor quality survey responses and identify respondents who randomly (or near-randomly) clicked through the choice task.
- First, create a conjoint exercise (choice task) with random respondents. Sawtooth Software’s Lighthouse Studio allows you to do it with only a few clicks. All it takes is a few minutes and you’ve generated a dataset with random respondents. Think about them as ‘bots’ who have no preference for any options. Once you’ve generated a random dataset, step two: run the conjoint analysis. Make sure you use the HB (hierarchical Bayesian) methodology, so you will have utility estimates for each ‘bot’ survey taker.
- Then look at the Root Likelihood fit scores for the survey respondents. Now, remember, these were randomly generated bots and not real survey takers, and we still calculated Root Likelihood fit metrics for each. The scores should be very close to the chance probability, but there may be some random variation as some bots might have gotten lucky.
Because of the random variation for the Root Likelihood fit metrics for the random respondent, I usually find the 80th percentile Root Likelihood score for the random bots and call that score the cut-off score. I will use that cut-off score to flag every real survey respondent whose Root Likelihood score is lower than this number.
If a real respondent scores lower than 20% of random bots, I consider that survey taker’s choices random – and certainly not carefully considered. That survey respondent should probably be cut from the data as their response damages the overall data quality. Using this cut-off method, I review the Root Likelihood scores for the real data – and flag every respondent whose Root Likelihood score is lower than the threshold.
So how do you improve your data quality?
First, complete your survey and conjoint task on random respondents, then run an HB conjoint analysis. When done, inspect their Root Likelihood fit metrics and find the 80th percentile score. Make this score the cut-off score for your real respondents – and flag everyone who is lower than the cutoff.
An important note is that your conjoint data set should have enough questions to be able to distinguish between good and random respondents. If each level of each attribute appears at least six times across conjoint questions for each respondent, you are in good shape for this approach. If each level appears three or fewer times, then you probably shouldn’t use this approach and it will be very difficult to tell between real and random responders using the Root Likelihood.
There, now you have a handy way to ensure that you have purged your conjoint analysis of poor quality, random respondents and improved overall data quality. This procedure is quite important, as you’d be surprised how often survey respondents quickly click through a conjoint exercise.
Without cleaning your data, important outcomes such as Willingness to Pay for enhanced features will be incorrect and exaggerated. You will also overestimate preference for low-quality products. If you think it won’t happen to you, it most likely will – in fact, it almost certainly has happened to you. So be alert and use the Root Likelihood fit score to strengthen your data quality.
Comments
Comments are moderated to ensure respect towards the author and to prevent spam or self-promotion. Your comment may be edited, rejected, or approved based on these criteria. By commenting, you accept these terms and take responsibility for your contributions.
Disclaimer
The views, opinions, data, and methodologies expressed above are those of the contributor(s) and do not necessarily reflect or represent the official policies, positions, or beliefs of Greenbook.

Sign Up for
Updates
Get content that matters, written by top insights industry experts, delivered right to your inbox.