Categories
Customer Acquisition Forecast
How to effectively measure advertising effectiveness.
You Want More Customers, Don’t You?
Advertising copy research has a long history and strong rationale. The production and media investments are costly, and if the research can ensure ads will effectively boost sales, then the research dollars are well spent. It is when we get down to the details of how exactly to define and measure “effectiveness” that things become murkier.
Measuring advertising effectiveness is a much-debated topic. Some of the debates include the following:
- What is the best metric to use? (purchase intent, persuasion, recall, liking, etc.)
- Should a single criterion or multiple metrics be used?
- Are rational or emotional parameters, or some combination, best?
- How should the stimulus be exposed (forced or incidental, monadic, or within clutter), and how many times?
The Struggle for Meaningful Context
Even with the choice of metric and methodology in hand, the resulting number needs meaning attached. It has become relatively standard to compare the test ads to norms, prior results, and experience. While this practice is widely used, it is also widely panned – and with good reason. Norms represent a significant limitation. Even the very best normative databases are flawed. In fact, there’s nothing “normative” about them at all:
- They lack sufficient representation of all the brands in a category
- Tend to over-represent the supplier’s clients
- May include ads that have aired as well as those that were just tested and never broadcast
- They become dated very quickly – to name only a few of their problems.
The biggest issue might be that a normative database by nature represents the “database” itself and not the marketplace and media landscape. The same weight is given to small brands and large brands when that does not reflect competition in the real world. Comparing results to norms gives little to no indication as to what will happen in the market. It is just bad research, simple as that.
Validated, Predictive Measures
With these serious flaws, how can we predict the effectiveness of advertising in terms of real customers and real dollars, that any C-suite executive can understand – and appreciate? We developed a model, Customer Acquisition Forecast™, that addresses these weaknesses, with validated, predictive results, independently tested and certified by The Marketing Accountability Standards Board (MASB).
Our Customer Acquisition Forecast™ model uses three foundational inputs:
1. Using advanced modeling, we establish the REAL marketplace norm, taking into account the marketplace and media landscape at the time of the test, the number and size of competing brands and variants, brand loyalties, geographic differences, and recent changes on all dimensions. This Fair Share Benchmark is re-established with each test, so it’s always up to date and current, and there is no reliance on prior testing history or normative databases.
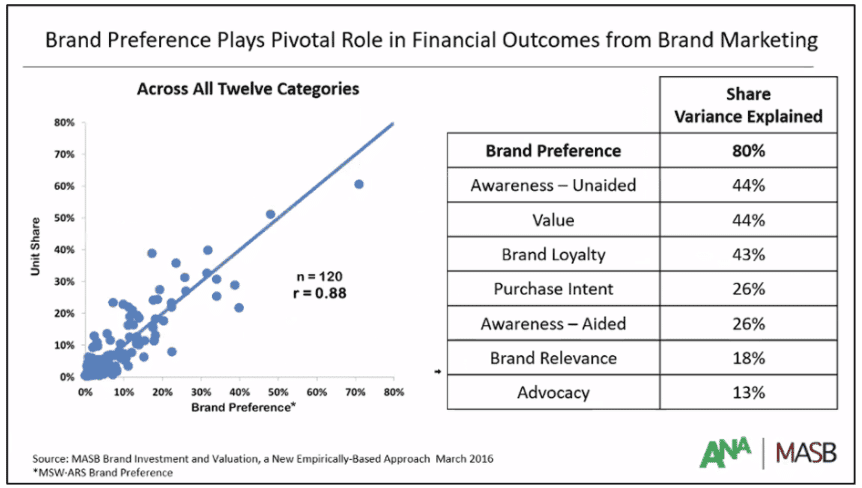
2. The predictive advertising effectiveness tracking metric is Customer Commitment Preference™ (CCPreference™). MASB independently tested nearly 70 different metrics of pre-advertising brand strength (including unaided awareness, value, loyalty, purchase interest, and more). They identified CCPreference™ as the most predictive of actual unit market share with an overall correlation of .88. The study included a diverse set of 120 brands from 12 categories – some highly fragmented while others had few brands; some considered purchases with prices up to $40K while others were impulse categories with items under $1. Uniquely, brand preference showed a strong relationship to unit share across all categories.
3. Building on CCPreference™, Customer Commitment Persuasion™ (CCPersuasion™) is a unique pre-to-post copy testing metric that establishes the change in a brand’s market share or penetration after advertising. MASB also certified CCPersuasion™ and the metric successfully completed Marketing Metric Audit Protocol. The audit concluded that CCPersuasion™ can quantify the likelihood and magnitude of an ad’s impact on sales volume and market share. One published study that substantiates this conclusion relates the predicted sales volume impacted by advertising to the actual sales volume impacted from independent Marketing Mix Modeling analysis:

MASB Certified that CCPersuasion™ can be used to:
- Quantify likelihood and magnitude of advertising’s impact on future sales volume/market share for the advertised brand and brand portfolio (halos), for the next four weeks and the next business quarter.
- Quantify/allocate the appropriate level of GRP spending for discrete executions, within and across brands, based on absolute and relative strengths to optimize return for brand, division, company.
- Evaluate the observed preference shift relative to the expected shift for a brand of its size in its competitive environment (the FAIR SHARE® benchmark). The benchmark derives from three factors: the brand’s size or % preference before exposure to the advertising, the number of brands competing with it, and the extent to which consumers in the product category typically switch brands from one choice occasion to the next.
- Determine whether an ad should be aired, based on an expected level of in-market sales response or CCPersuasion™ level relative to the Fair Share benchmark.
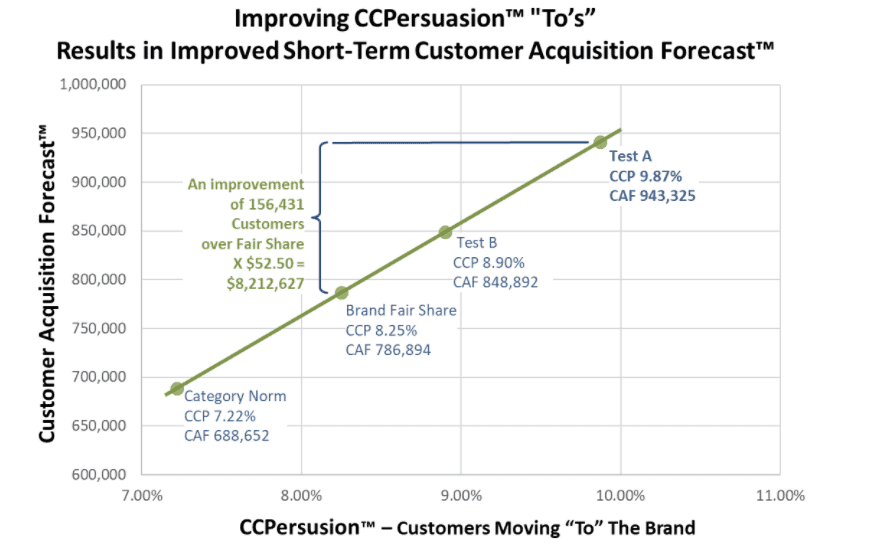
Additionally, if clients can create ads that improve the CCPersuasion™ score (that is, increase the percentage of customers that move to the brand post-advertising) it will result in a higher Customer Acquisition Forecast™.
Build a Transparent Model: Customer Acquisition Forecast™
Customer Acquisition Forecast™ (CAF™) builds on CCPreference™ and CCPersuasion™ to help provide a clear answer to advertisers’ pragmatic questions on the effect of their advertising. Specifically, CAF™ provides advertisers with a forecast of the number of customers or clients – new, lapsed, and/or loyal that increase usage/purchase frequency – acquired from a specific ad unit (i.e., TV, digital, print, etc.)
Using two pieces of client-supplied data, effective reach and market size (such as customer base, category volume, or units sold), the model applies CCPreference™ and CCPersuasion™ to calculate the Customer Acquisition Forecast™. Establishing this forecast using proven, independently certified and the U.S. patented metrics gives a strong foundation for accuracy.
The Bottom Line: Get More Customers
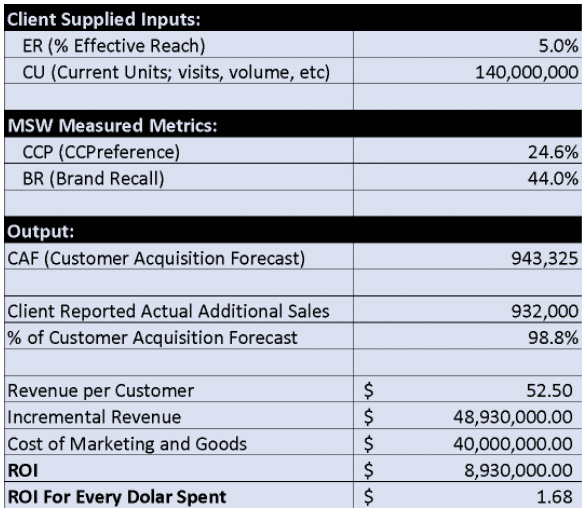
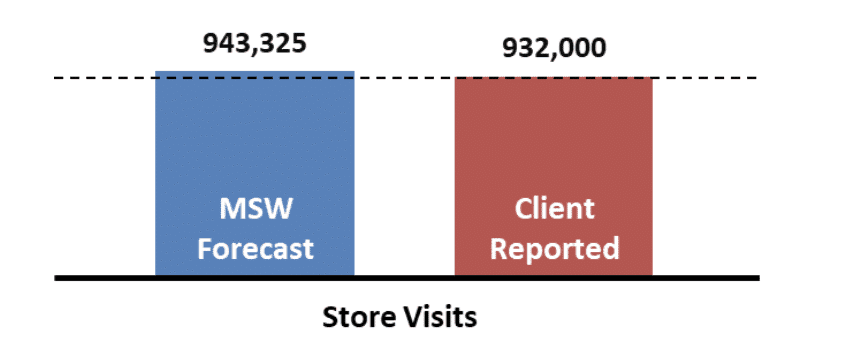
In this case study for one of the nation’s largest retailers, MSW Customer Acquisition Forecast™ was for 943,325 store visits, which was within 1.2% of their reported visits. Our client shared their average checkout of $52.50, which enabled us to forecast an incremental revenue of $48,930,000 offset by their cost of marketing and goods produced an ROI of $8,930,000 or +$1.68 for every dollar spent.
The application of advertising pre-testing can go a long way toward mitigating the risk inherent in media spend and ensuring the initiative’s profitability. In this case, we evaluated two ads for the client, and based on the results they chose to air the ad that produced a CAF of 156,431 more customers than their own Brand Fair Share.
The more precisely we can predict effectiveness – in a format easily understood and applied by the marketing team – the more confidence the advertiser can have in using the research to adjust the spend, optimize their marketing and ensure their ability to handle expected demand. Customer Acquisition Forecast™ represents the latest step toward optimizing the practical usefulness of advertising effectiveness research.
Comments
Comments are moderated to ensure respect towards the author and to prevent spam or self-promotion. Your comment may be edited, rejected, or approved based on these criteria. By commenting, you accept these terms and take responsibility for your contributions.
Disclaimer
The views, opinions, data, and methodologies expressed above are those of the contributor(s) and do not necessarily reflect or represent the official policies, positions, or beliefs of Greenbook.
ARTICLES
Top in Research Methodologies
Future Trends Emerging in Mixed-Method Marketing Research
Explore the future of mixed-method marketing research, including AI, synthetic data, continuous insights, and evolving research workflows.
Ashley Shedlock
Content Producer at Greenbook
When Easy Becomes Empty: The Frictionless Feedback Fallacy
Making surveys easier doesn’t always improve insights. Discover why thoughtful feedback design balances convenience with meaningful, reflective respon...
Tarik Covington
Founder & Chief Strategist at Covariate. Human-Centered Insights
The Always-on Agency: How to Survive the Shift to Intelligence-Native Organizations
The insight agency model is under pressure. In an always-on world, success depends on becoming a decision partner, not just a supplier of research pro...
Hannah Mann
Founding Partner at Day One Strategy
The Ambiguity of Frequent Survey Participation: Is “Hyperactivity” a Signal of Professional Fraud?
Learn how to identify engaged respondents, detect bad actors, and improve data quality for more reliable research outcomes.
Sebastian Berger
Head of Science ReDem at Rep Data

Sign Up for
Updates
Get content that matters, written by top insights industry experts, delivered right to your inbox.